The Precision Gap: Why Retrospective Estimation Fails Enterprise Architecture
In our previous deep dives, we dismantled the illusion of static carbon factors and explored how treating emissions as fixed metrics leads to structural compliance failure. But understanding the fluid, dynamic nature of carbon data is only the first step. The true operational bottleneck lies in how your enterprise IT and OT (Operational Technology) architectures capture, structure, and process this raw telemetry at scale.
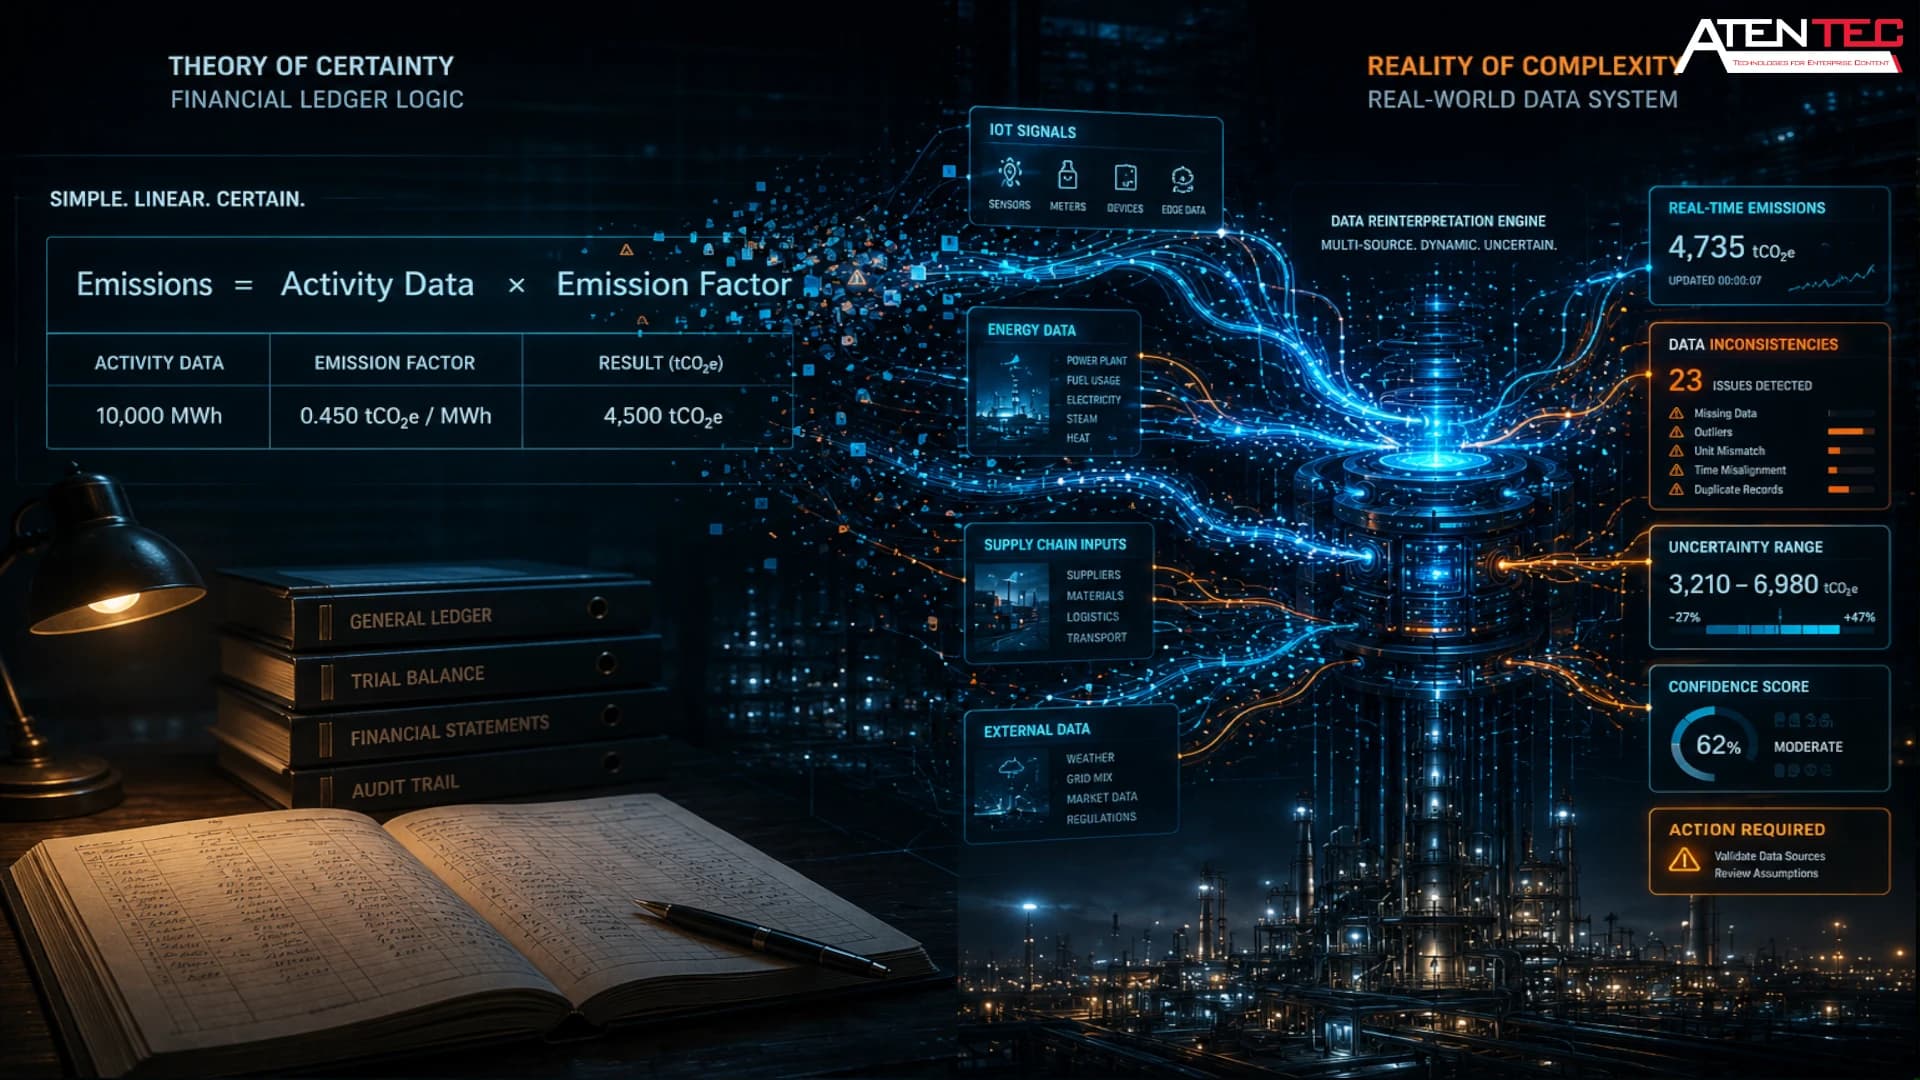
For decades, industrial enterprises have treated carbon accounting as a branch of retrospective financial auditing: historical, periodic, and heavily reliant on top-down estimations. CTOs, CIOs, and Operations Managers are routinely forced to rely on utility invoices from the previous quarter or generic, aggregated industry averages to compile regulatory sustainability reports.
This creates The Precision Gap. A carbon footprint calculated from aggregated monthly utility bills is a lagging indicator—completely blind to real-time operational inefficiencies, localized equipment degradation, and fluctuating grid carbon intensities. In a shifting regulatory landscape increasingly governed by strict enforcement frameworks like Europe's CBAM (Carbon Border Adjustment Mechanism), relying on retrospective estimates is no longer just a reporting flaw; it is an active financial liability that directly threatens market access, credit ratings, and product pricing margins.
Shifting from Periodic Tracking to Continuous Data Pipelines
To bridge this gap, modern industrial ecosystems must transition from periodic tracking to continuous, real-time measurement infrastructure. Within the bilateral I-DNTITI Hub framework—supported by the British Council and Egypt's Science, Technology & Innovation Development Fund (STDF)—this paradigm shift is being actualized as a sovereign digital infrastructure designed to steer industrial clusters toward rigorous net-zero benchmarks. Carbon emissions must be treated exactly like any other core industrial metric—such as pressure, temperature, flow rate, or throughput.
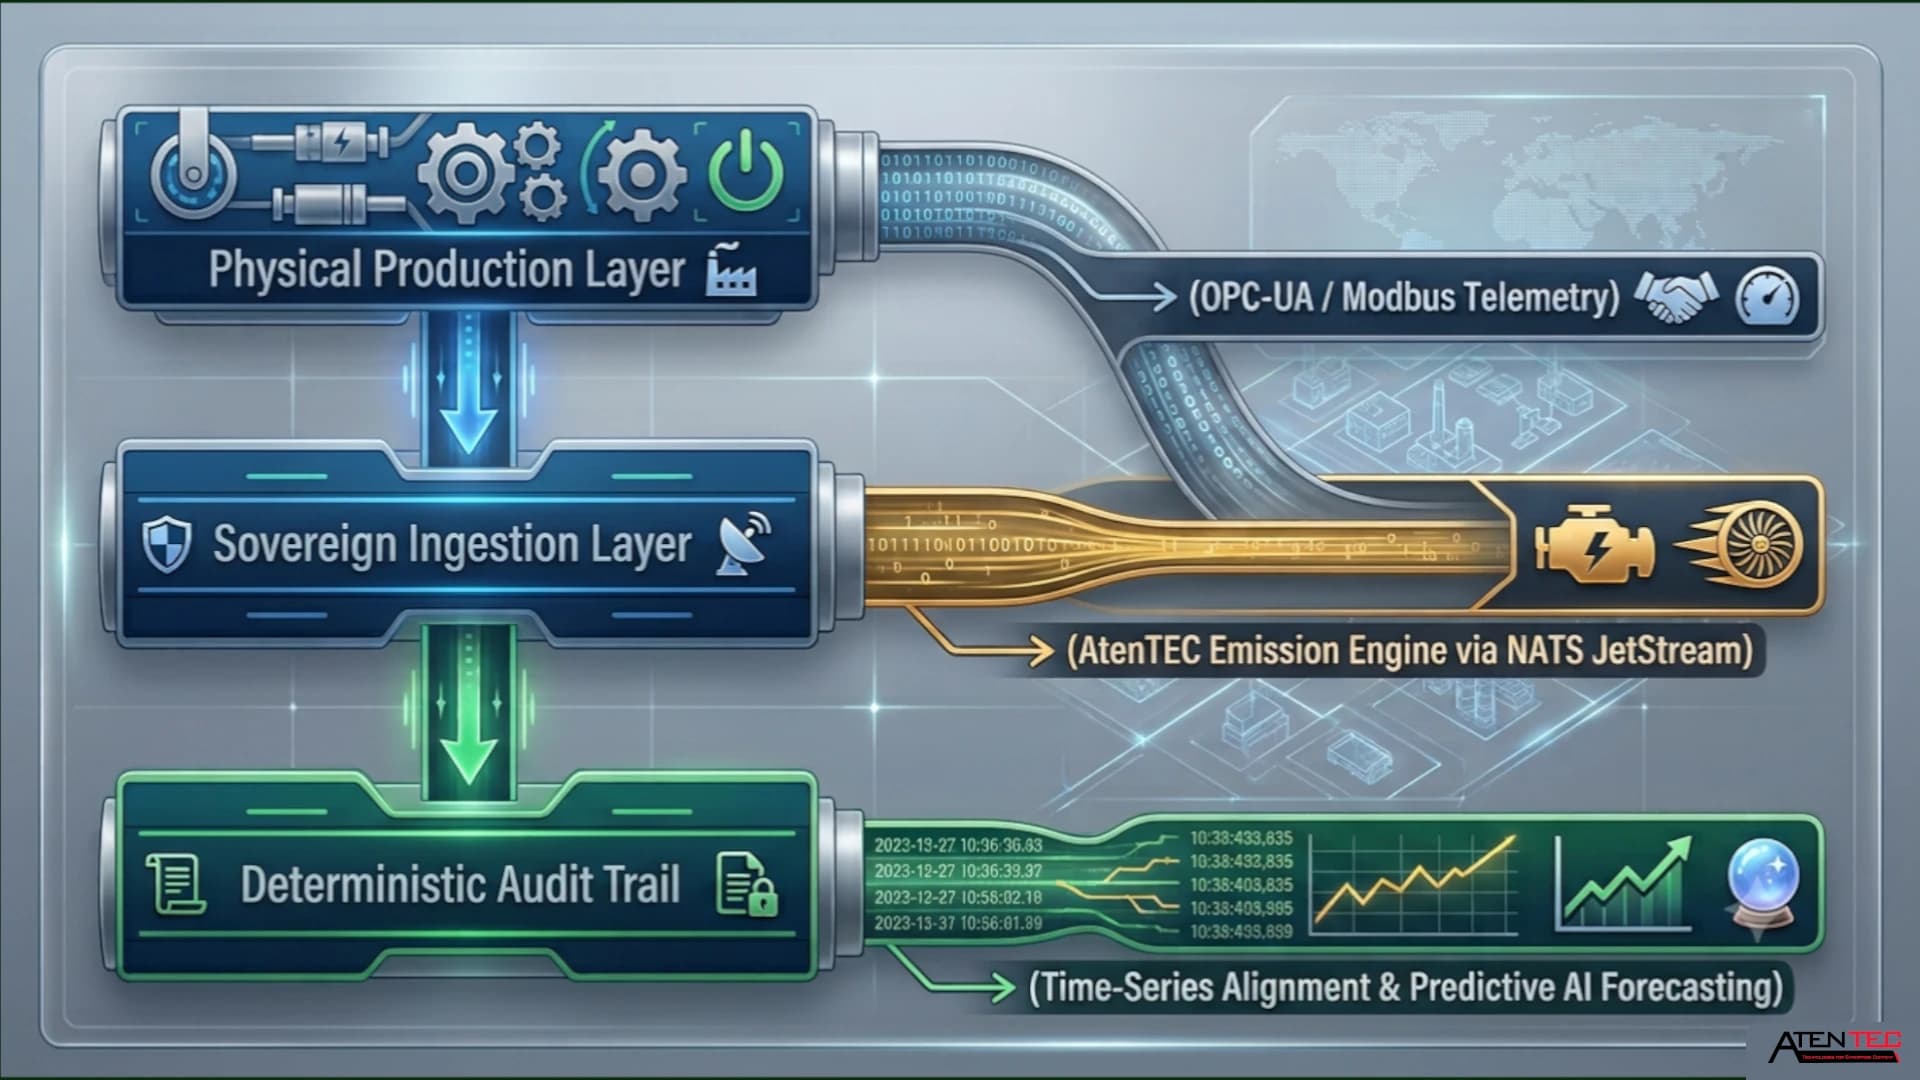
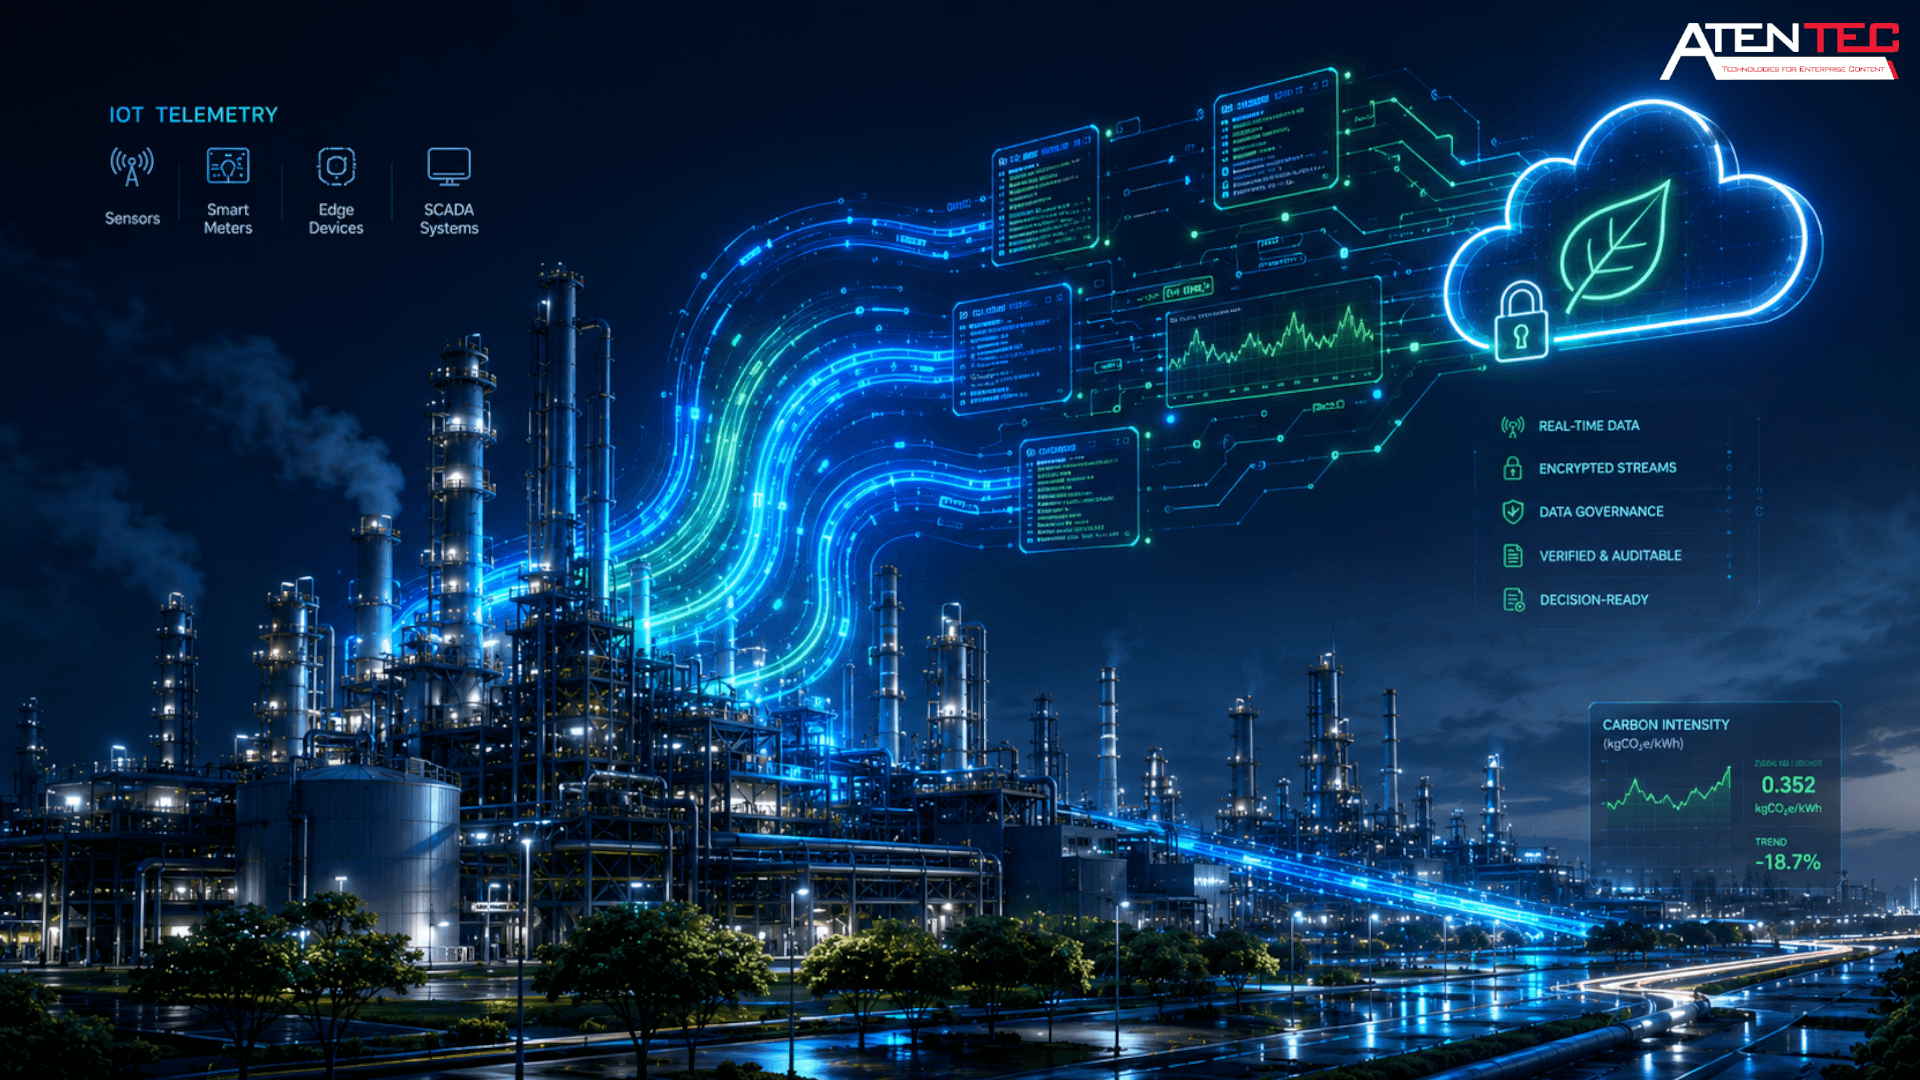
This transition requires a fundamental shift in your data architecture. Instead of waiting for manual data entry at the end of a reporting cycle, a continuous measurement system establishes a direct, automated pipeline from physical infrastructure to analytical dashboards.
By capturing time-stamped, localized activity data directly from smart meters, factory SCADA systems, and edge IoT devices, your enterprise eliminates human error, data tampering risk, and latency. Continuous measurement transforms carbon tracking from a reactive compliance exercise into a proactive operational tool, allowing systems engineers to identify high-emission events in real time and optimize workflows before inefficiencies solidify into irreversible financial liabilities.
The Aliasing Error: The Technical Butterfly Effect of Data Latency
The core vulnerability that most enterprise technical leaders overlook when relying on delayed data is a mathematical anomaly known as Data Aliasing. When an infrastructure system samples data at irregular or insufficient intervals—such as pairing monthly utility totals with shifting, hour-by-hour grid carbon intensities—the calculation introduces severe mathematical skew.
If your facility experiences brief, high-intensity power surges during peak production hours, but your data pipeline averages that consumption across a 30-day block, the asynchronous alignment can mismatch consumption with actual grid intensity. This desynchronization can result in a structural calculation error, inflating or deflating your reported carbon footprint by up to 12% without a single change in physical production. For an enterprise handling high-volume exports, a 12% margin of error due to poor data sampling is the difference between a compliant product line and millions in unbudgeted carbon penalties.
Engineering the Solution: Multi-Node Telemetry Ingestion by AtenTEC
Deploying a continuous measurement framework introduces an immediate technical hurdle: system heterogeneity. A typical enterprise production facility does not run on a single, uniform software stack or communication protocol. Instead, your infrastructure is likely a fragmented patchwork of legacy PLC networks, fieldbus hardware, disparate smart meters, proprietary ERP databases, and siloed logistics logs.
Attempting to build custom scripts to manually aggregate Modbus telemetry from the factory floor, OPC-UA streams from machine interfaces, and relational SQL/NoSQL tables from enterprise applications (like SAP or ATUM ERP) is an engineering nightmare that introduces severe data integrity risks.
This is precisely where the AtenTEC Emission Engine operates as the core digital orchestrator within the I-DNTITI infrastructure.
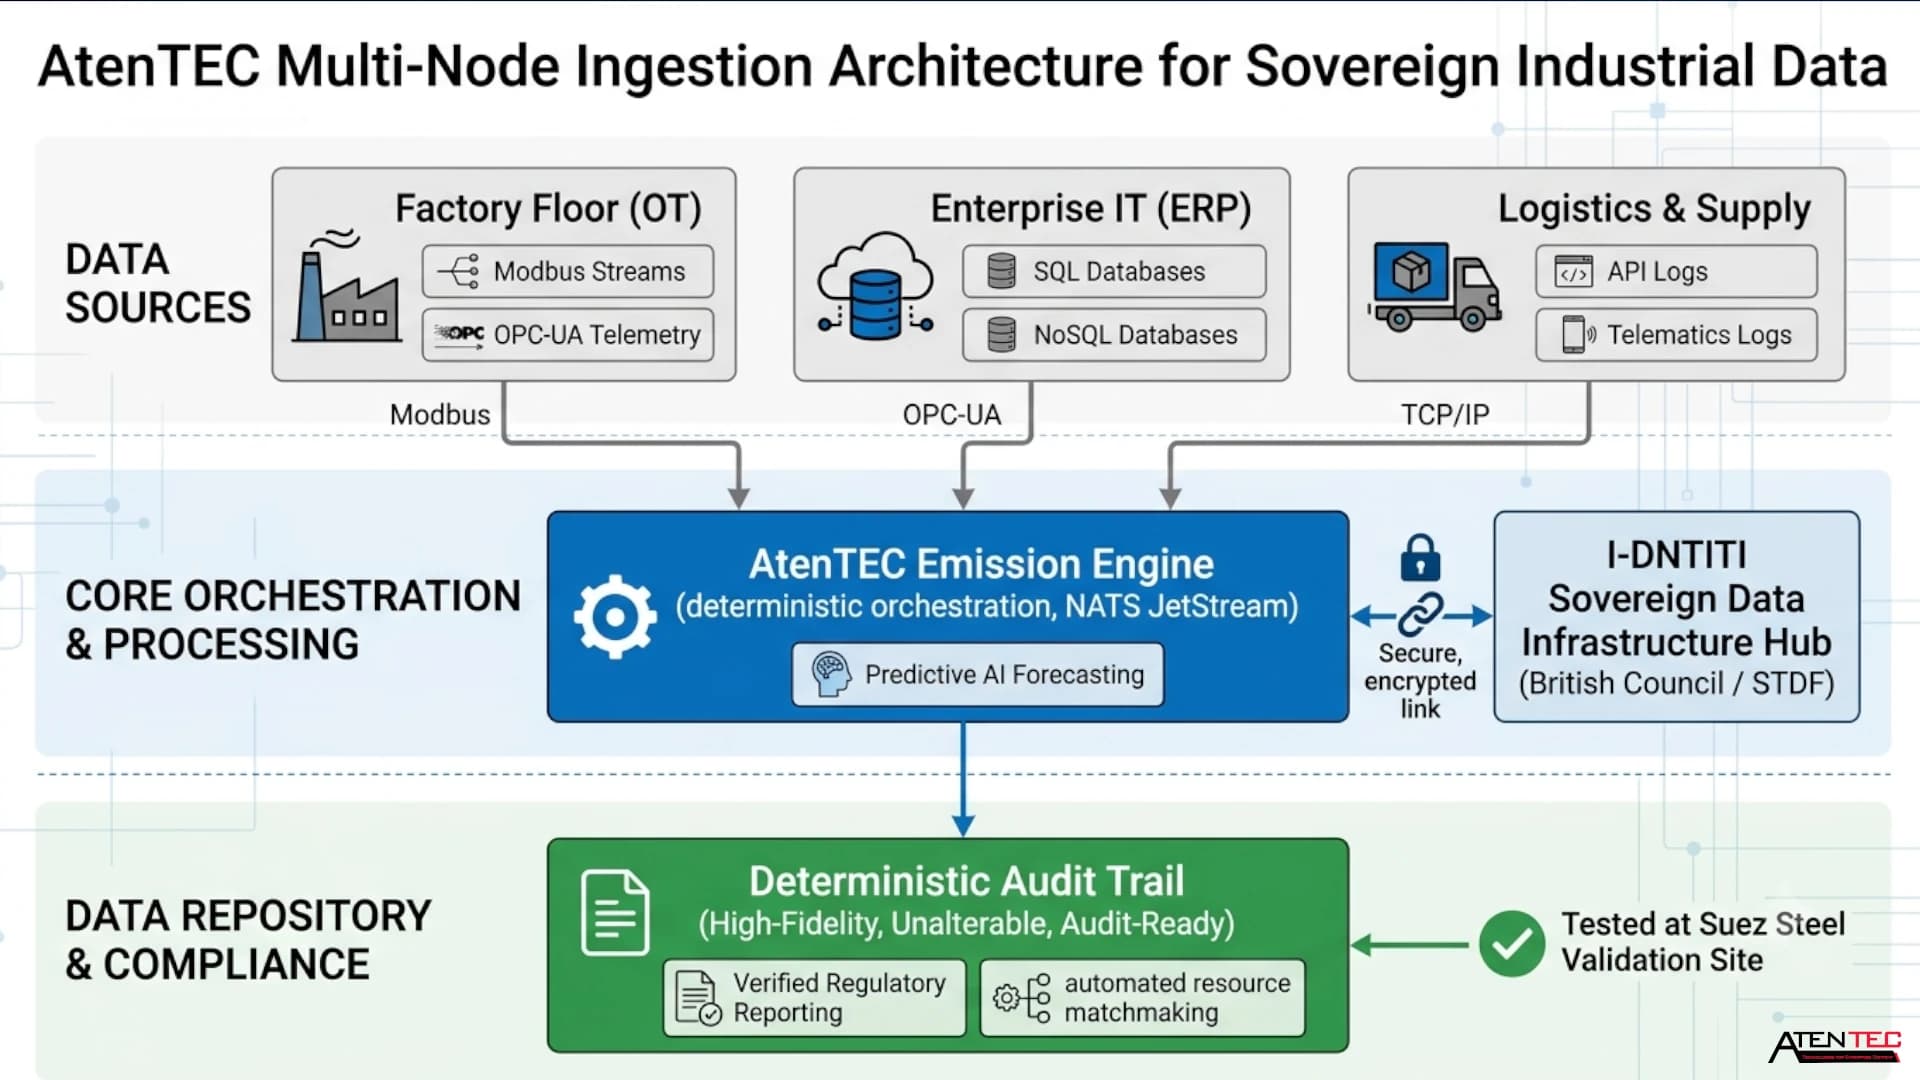
Rather than forcing an expensive, top-down overhaul of your existing legacy infrastructure, the AtenTEC Emission Engine functions as a unified multi-node telemetry ingestion layer. Engineered to withstand the rigorous demands of heavy industries—and actively validated at major industrial nodes —the engine leverages advanced stream processing driven by high-performance protocols like NATS JetStream.
This architecture allows the engine to ingest and normalize thousands of concurrent telemetry streams every second, converting fragmented operational data into clean, time-series data models. By enforcing deterministic data orchestration and pairing it with predictive AI carbon forecasting, the AtenTEC platform guarantees an unalterable, high-fidelity audit trail that satisfies both cross-border regulatory verification and automated resource matchmaking requirements.
Summary and Next Steps
Transitioning to continuous measurement systems changes carbon tracking from a retrospective guessing game into a high-fidelity tool for operational control. By automating data ingestion at the source, your enterprise removes the blind spots of periodic reporting and gains the precise insights needed to navigate modern industrial regulations.
You are here:
Explore the Full Series:
├── 1. Core Concepts (Completed ✅) 👉 Content Series Overview
├── 2. Measurement Systems 👉 (You are here)
│ ├── Scope 1 / 2 / 3 👉 (Next Article)
│ ├── emission factors 👉 (Upcoming)
│ ├── lifecycle assessment (LCA) 👉 (Upcoming)
└── MRV systems 👉 (Upcoming)
In our next article, we will go deep into Activity Data, exploring the exact mechanisms the AtenTEC Emission Engine uses to extract, filter, and structure raw operational telemetry from complex factory environments
Frequently Asked Questions
What is the I-DNTITI Hub and what is AtenTEC's role?
The I-DNTITI Hub is a bilateral strategic initiative bridging the UK and Egypt, funded by the British Council and STDF. AtenTEC is the primary technology partner responsible for engineering the Digital Orchestrator (WP02), which serves as the high-performance computational engine managing real-time GHG telemetry and predictive analytics.
What is Data Aliasing in carbon accounting?
Data Aliasing occurs when low-frequency sampling (like monthly data) is paired with high-frequency variables (like real-time grid changes). This mismatch desynchronizes consumption data from actual emission factors, creating mathematical errors that can skew a facility's reported footprint by up to 12%.
How does the AtenTEC Emission Engine ensure data integrity in heavy industries?
Validated at high-capacity sites like Suez Steel, the AtenTEC Emission Engine uses deterministic data orchestration and NATS JetStream protocols to capture and process data directly from Modbus and OPC-UA streams, preventing data latency or loss.
Why are monthly utility invoices insufficient for B2B carbon compliance?
Monthly utility invoices provide aggregated, lagging metrics that mask operational volatility. They fail to capture real-time fluctuations in grid carbon intensity or brief spikes in production emissions, making it impossible to calculate the accurate product-level footprints required by cross-border regulations like CBAM.
Optimize Your Industrial Data Infrastructure
Are you ready to replace unreliable estimates with verified, automated data pipelines? Contact the AtenTEC technical team today to schedule an architectural deep dive and evaluate your facility's readiness for real-time carbon tracking.
Request a Technical Demonstration | Read the Next Article: Activity Data👉 (Upcoming)