Carbon Intensity: The Strategic Metric That Decouples Business Growth from Environmental Impact
What is carbon intensity and how does it change decision-making?
In the traditional industrial mindset, economic expansion was a zero-sum game with nature: to produce more, you had to emit more. For decades, a factory’s "Carbon Footprint" was seen as a shadow that grew in direct proportion to its success. But today, as we transition toward a Net-Zero reality, this linear relationship is no longer a necessity—it is a financial liability.
The most critical question for a modern CEO is no longer just "How much do we emit?" but rather: "How efficiently are we converting carbon into value?"
This is where Carbon Intensity enters the stage. At AtenTEC, we don't view this as just another sustainability KPI; it is the fundamental measure of Operational Excellence. It is the metric that determines whether your business will survive the coming wave of Carbon Taxes and CBAM regulations.
The Efficiency Paradox: Why "Absolute Emissions" Can Be Misleading
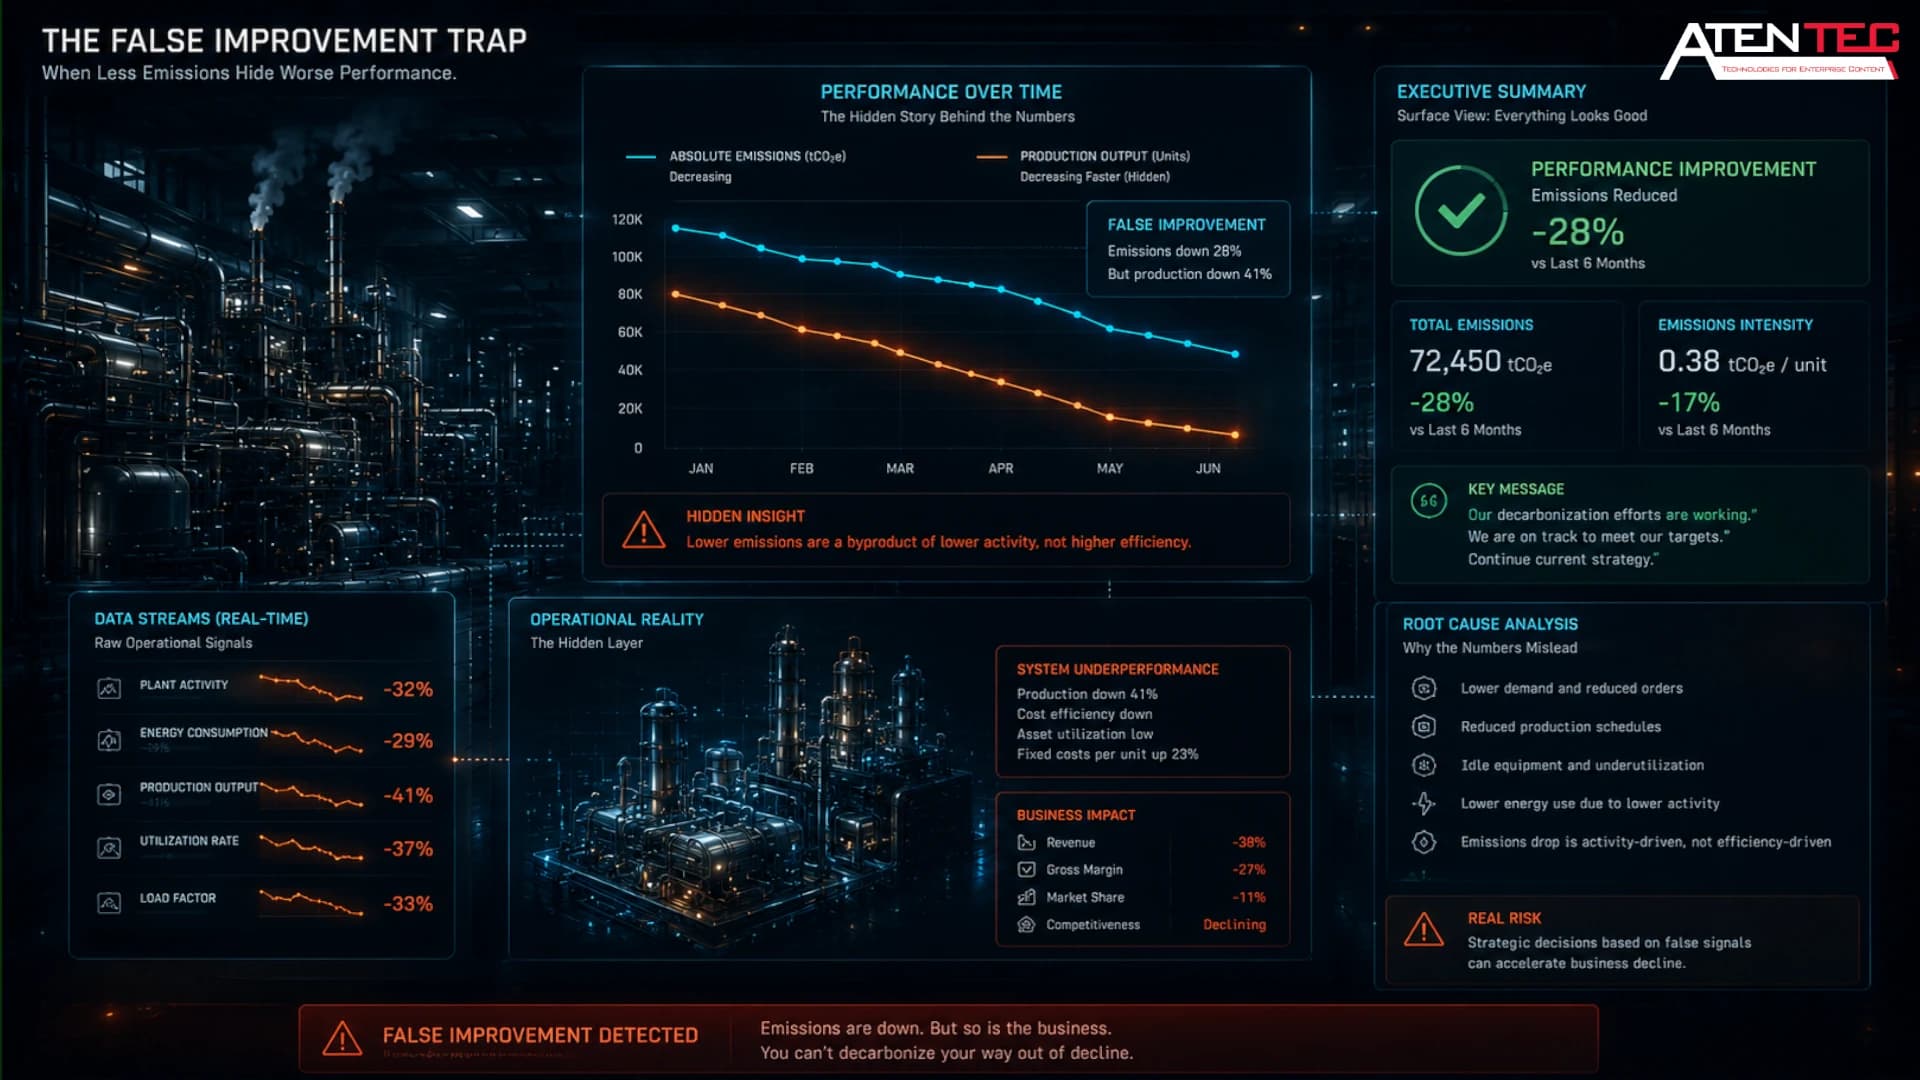
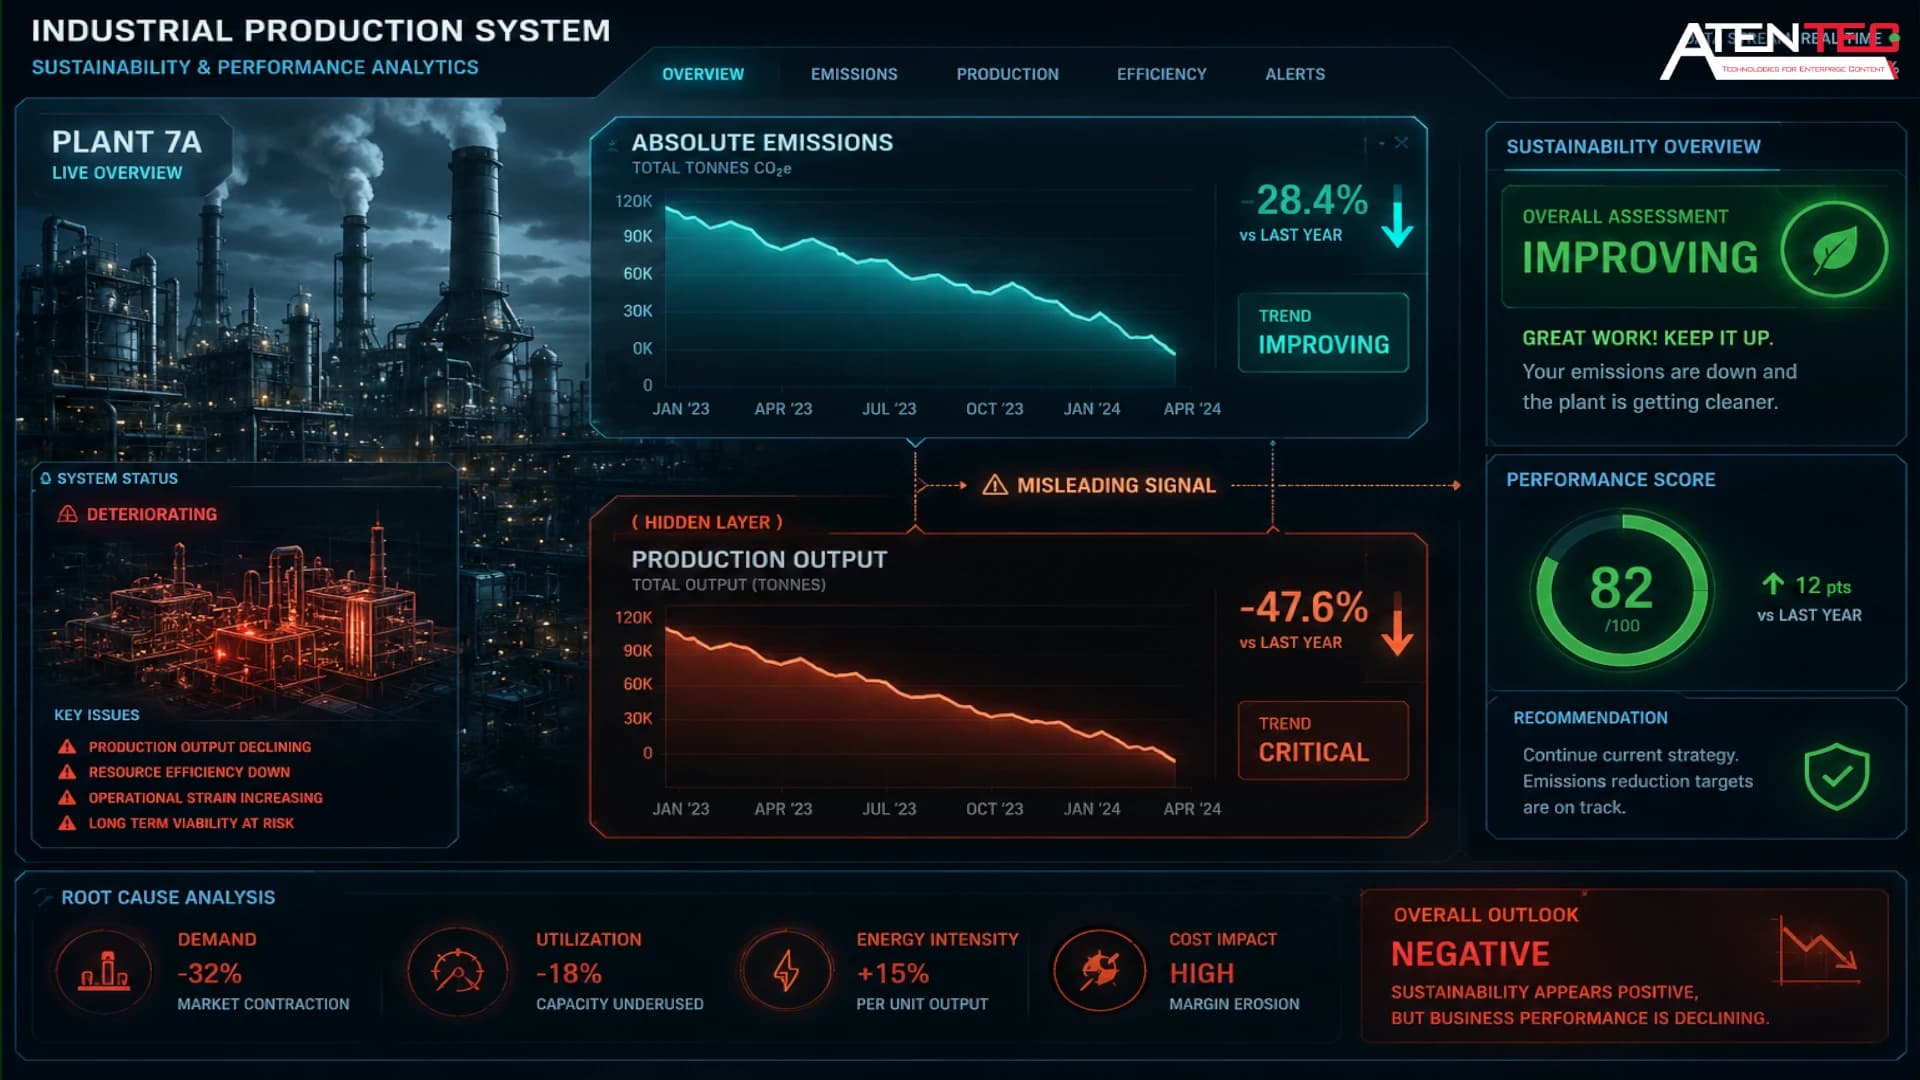
Many organizations celebrate a reduction in their total emissions (Absolute Footprint), but without looking at intensity, they might be celebrating a decline in their own business. If your emissions dropped by $10\%$ because your production fell by $15\%$, you haven't become "greener"—you've actually become less efficient.
Carbon Intensity provides the "Relative Truth." It measures emissions per unit of functional output—whether that is a ton of steel, a liter of chemical product, or a dollar of revenue.
The Formula for Operational Survival:

Industrial Deep-Dive: When Intensity Becomes a Pricing Weapon
To understand the power of intensity, we must look at the High-Dimensional Decision Space of modern industry. Let’s take the example of Green Ammonia production:
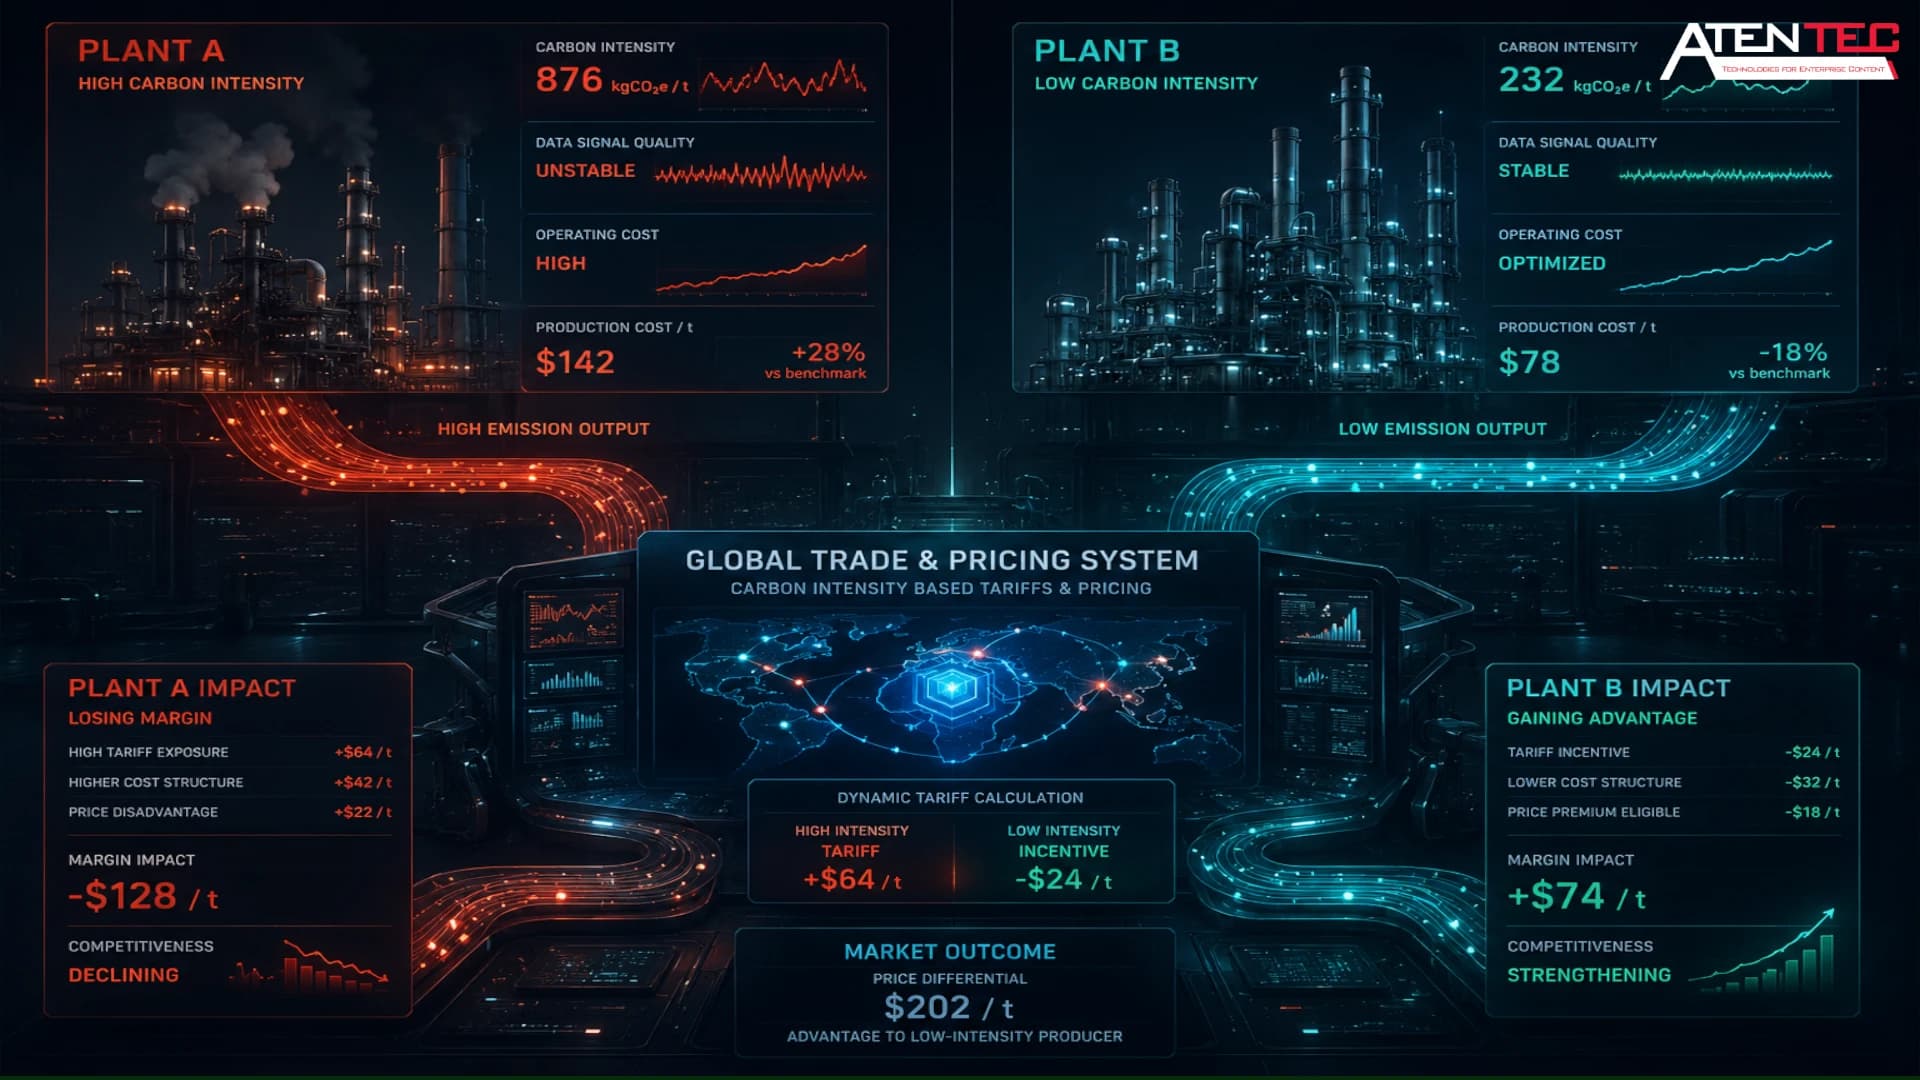
Imagine two competing plants. Plant A uses traditional monitoring and "estimated" emission factors. Plant B uses AtenG Technologies to track real-time energy loads and fugitive methane emissions.
- Plant A produces ammonia with an intensity of 2.4 tCO2e / ton.
- Plant B, through real-time optimization of its Haber-Bosch process using the AtenTEC Emission Engine, achieves an intensity of 1.6 tCO2e / ton.
When these two companies export to Europe under CBAM (Carbon Border Adjustment Mechanism), Plant A will be hit with a massive "Carbon Tariff" that wipes out its profit margin. Plant B, with its lower intensity, not only pays less tax but can also command a Green Premium in the market. In this scenario, Carbon Intensity—not labor or raw materials—is what decides the winner of the contract.
Decoupling Growth from Carbon: The Role of "Forecasting Scenarios"
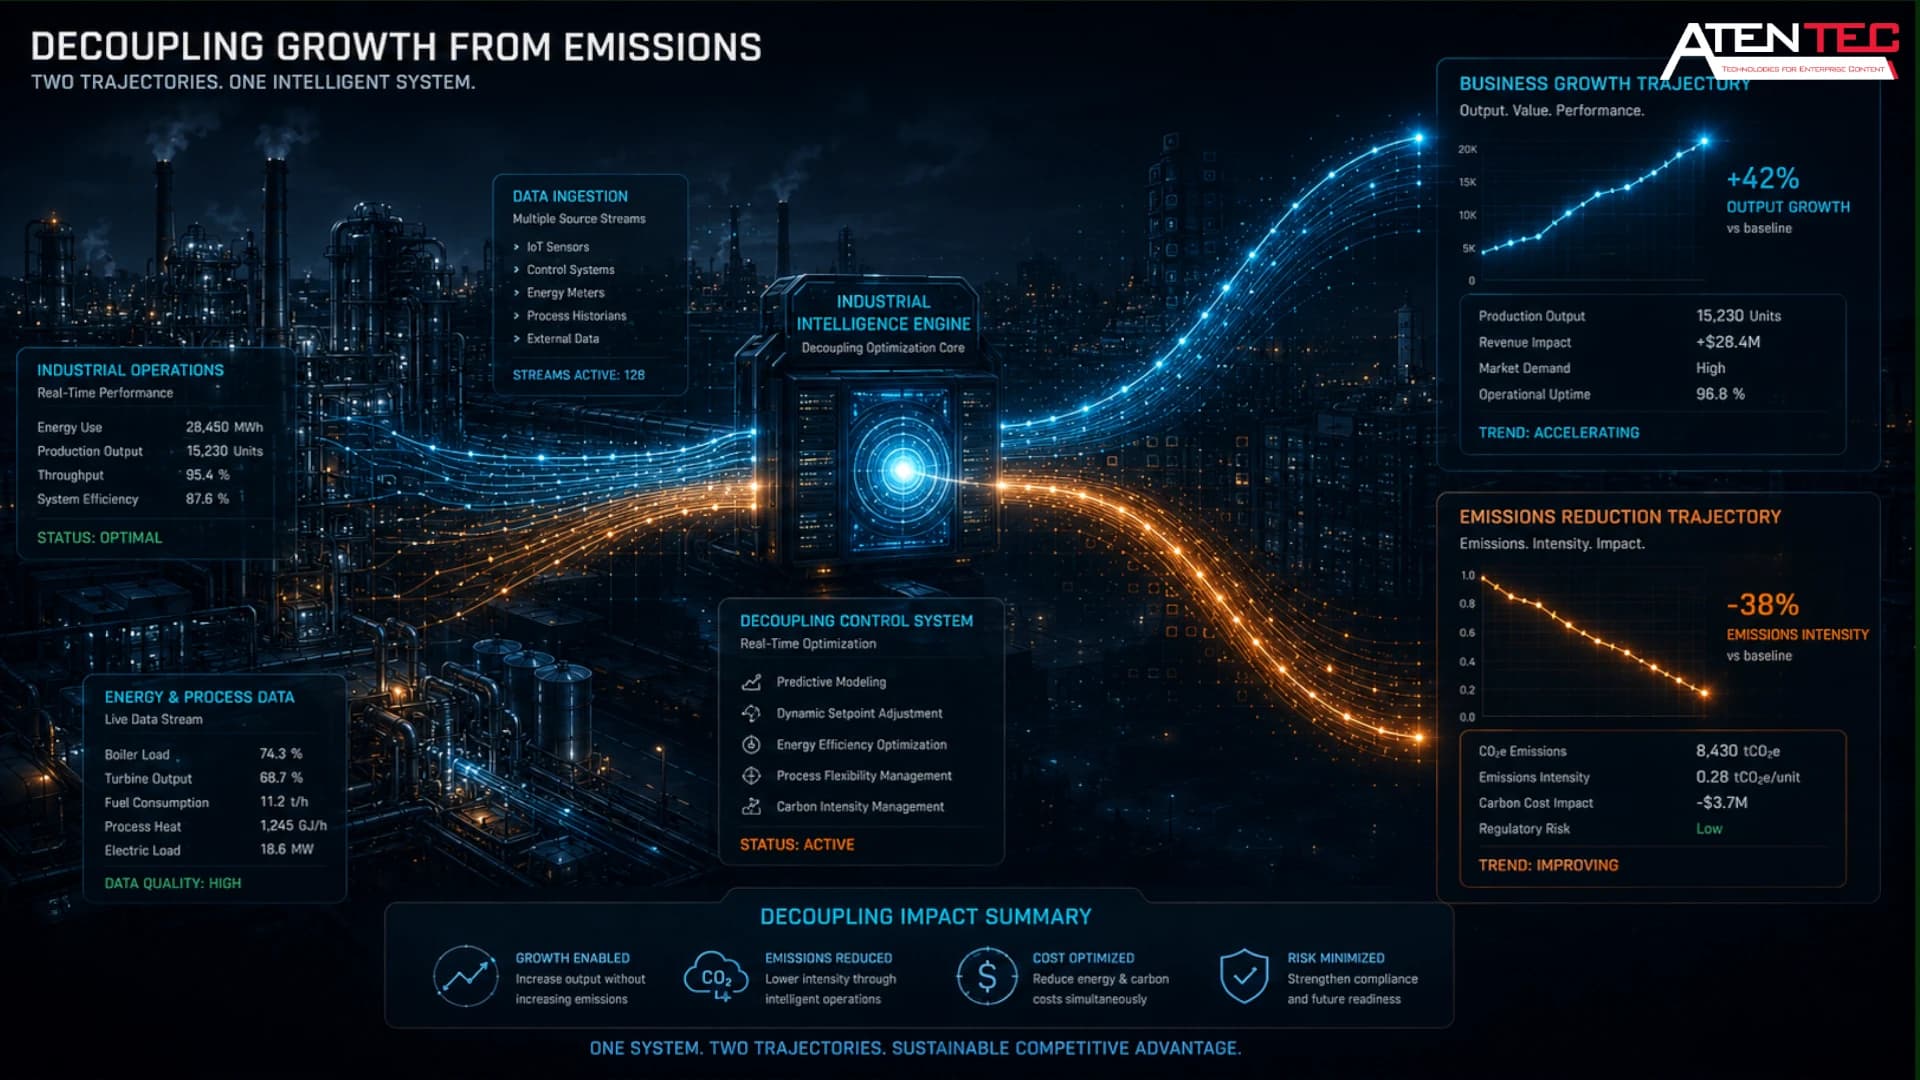
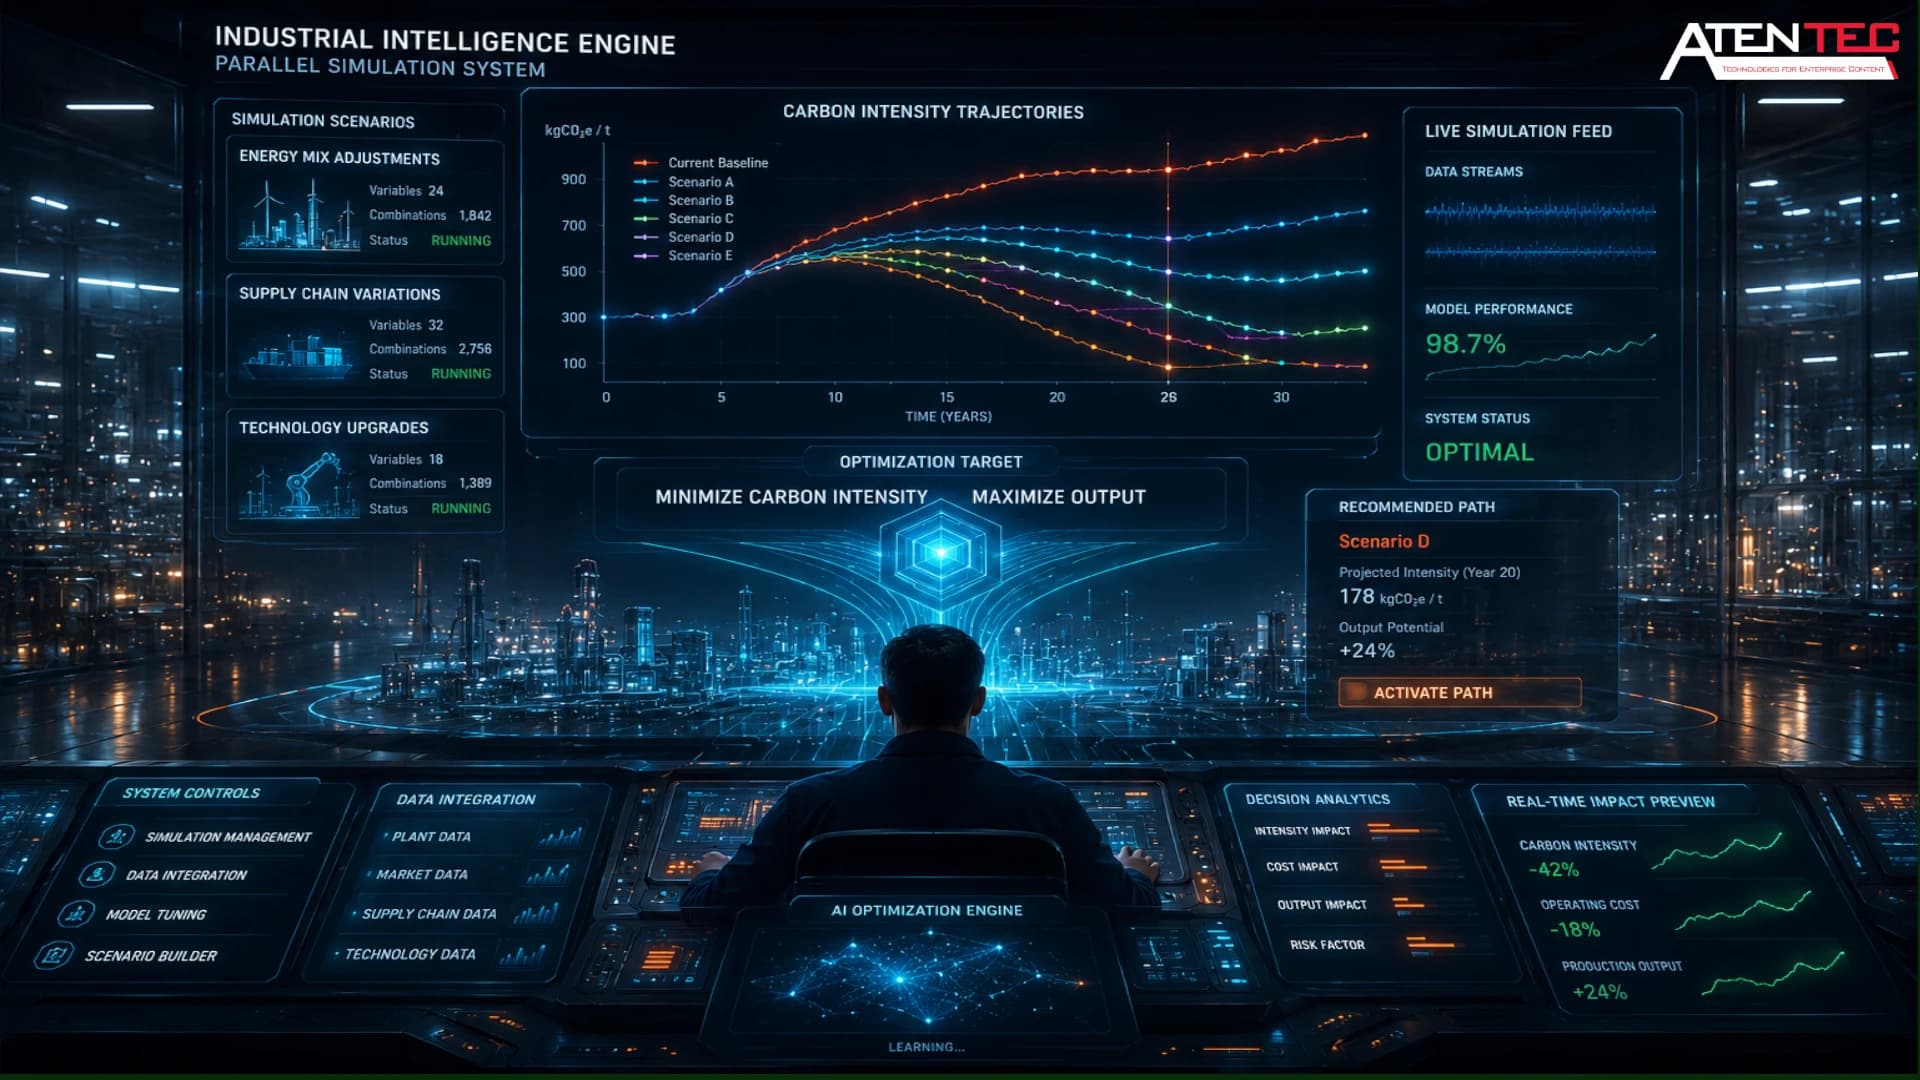
The ultimate goal for any enterprise is Absolute Decoupling: where your revenue curve goes up while your emissions curve goes down. This is the "Holy Grail" of the Net-Zero transition. Achieving this requires moving beyond static spreadsheets into Dynamic Industrial Data Systems.
By using Forecasting Scenarios, a company can simulate its intensity trajectory:
- The Energy Mix Factor: How would our intensity change if we shifted $30\%$ of our peak-load energy to on-site solar storage?
- The Supply Chain Factor: If our primary supplier reduces their Embedded Carbon by $15\%$, how does that improve our final product's intensity?
- The Technology Factor: Can we justify the ROI of a new high-efficiency turbine based on the avoided Carbon Tax costs over 10 years?
Why AtenTEC Emission Engine is the Engine of Decoupling
We don’t just report numbers; we provide the Technology Layer that makes decoupling possible. Our engine transforms intensity from a "post-event report" into a "real-time steering wheel":
-
IoT & Real-Time Monitoring: We link directly to your SCADA and IoT systems to capture energy spikes and gas leaks the moment they happen.
-
Granular Attribution: We attribute emissions to specific batches or production lines, allowing you to see exactly which part of your operation is "Carbon-Heavy."
-
Audit-Proof Data: Our system builds a digital trail that stands up to the most rigorous international audits, ensuring your intensity claims are backed by hard industrial data.
Strategic Synthesis: Reflecting on the Core Concepts Pillar
As we conclude this first pillar of our series, we have built a complete mental framework for the Net-Zero transition:
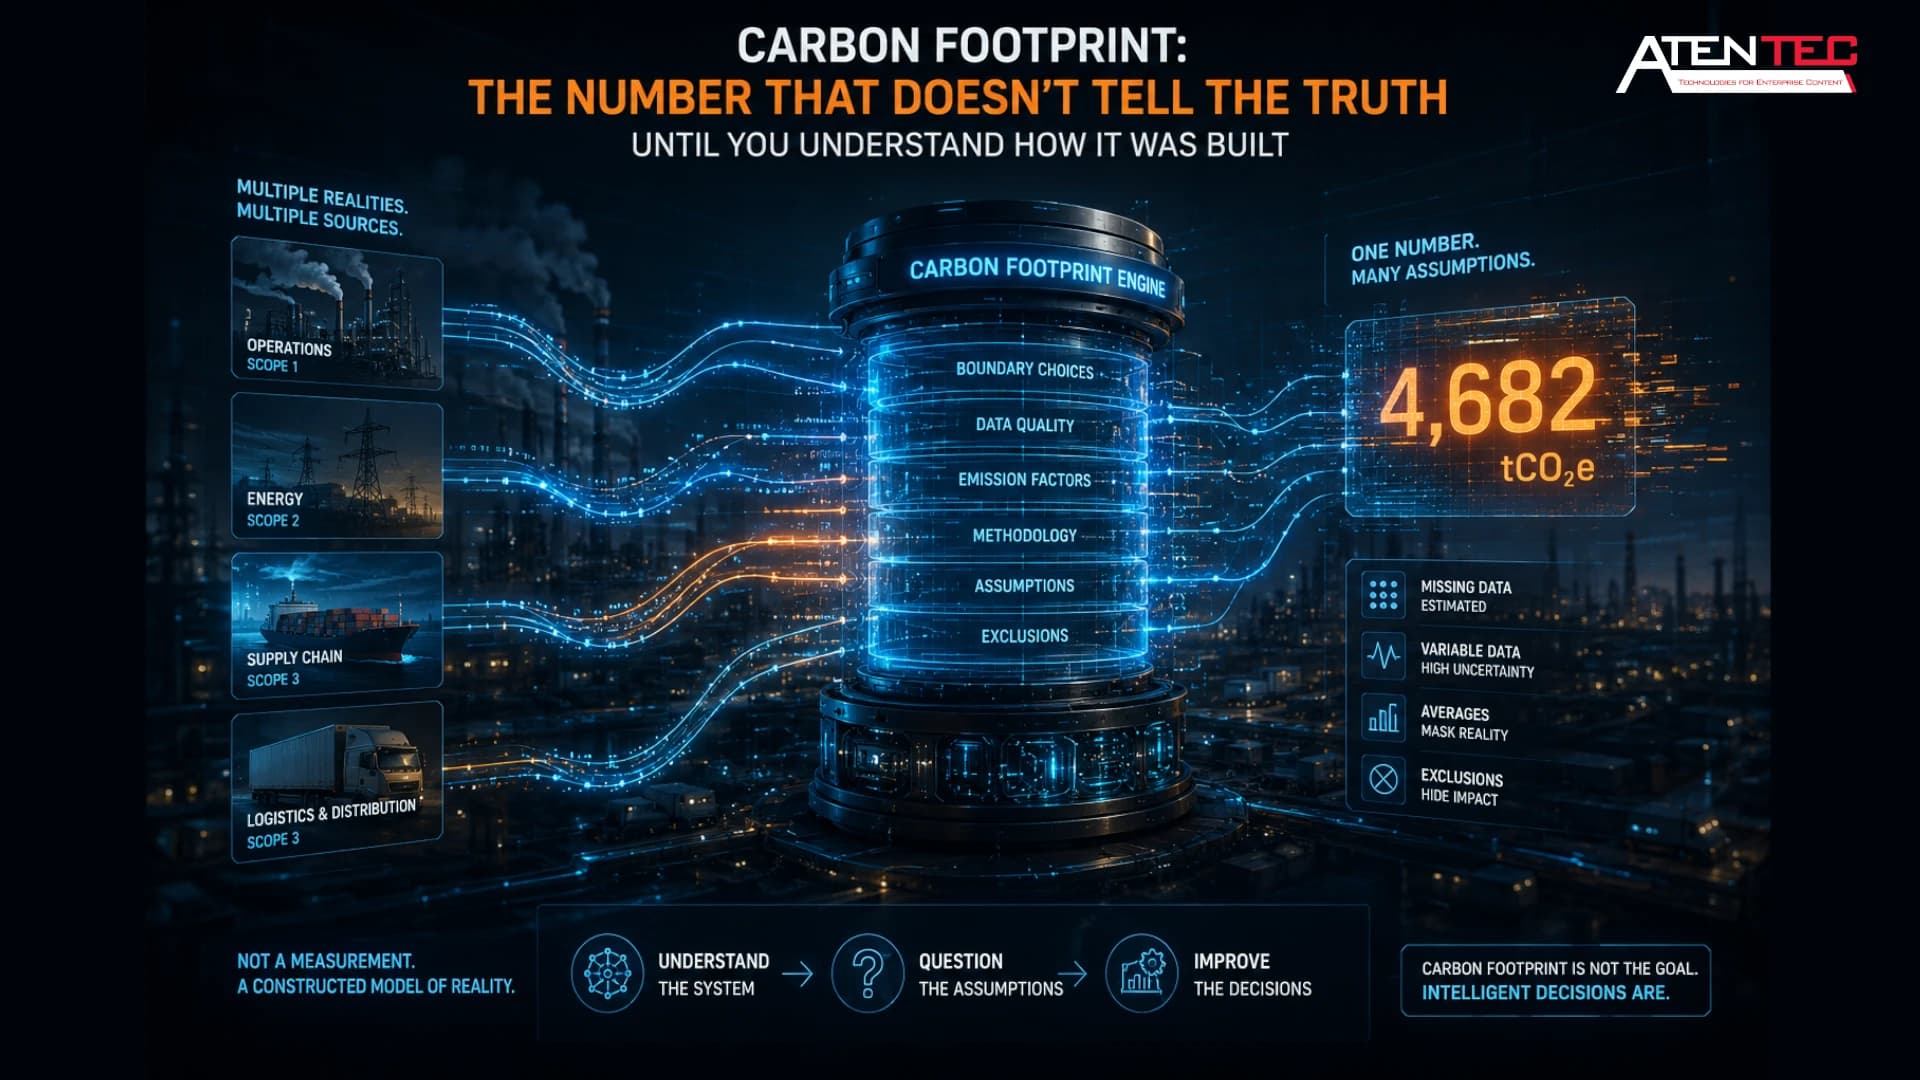
- Carbon Footprint: We moved from seeing it as a "number" to understanding it as a Constructed Model of operational reality.
- GHG Emissions: We exposed the "CO2 Trap" and showed why tracking gases like Methane and N2O is a financial necessity to avoid Expensive Blind Spots.
- Carbon Accounting: We redefined it as a Data Interpretation Problem, requiring a robust infrastructure to bridge engineering reality with financial compliance.
- Carbon Intensity: We identified it as the master metric for Operational Efficiency, the only way to grow your business without growing your liability.
By integrating these four concepts, your organization stops "reporting on the past" and starts "engineering a profitable, low-carbon future."
The Next Horizon: Where the Rubber Meets the Road
Mastering these concepts is the "Foundation." You now speak the language of the new economy. But in the real world, the most difficult challenge is data integrity. How do you track emissions across a global supply chain? How do you distinguish between Scope 1, 2, and 3 without losing your mind in a sea of spreadsheets?
The question is no longer "what" we need to do, but "how" do we prove our numbers are true under the cold light of a legal audit?
Are you ready to face the complexity of your Supply Chain?
Join us in our next series: Pillar 2: Measurement Systems, where we dive into the technical battleground of Scope 1, 2, and 3 and why Emission Factors are the most misunderstood part of your carbon ledger.
Explore the Full Series:
├── 1. Core Concepts (Completed ✅)👉 Content Series Overview
│ ├── carbon footprint (Read here) 👉 First Article:Carbon Footprint: The Number That Doesn’t Tell the Truth
│ ├── GHG emissions (Read here) 👉 second Article:GHG Emissions: Why CO₂ Is Not the Whole Story — and the Expensive Blind Spots You Are Missing
│ ├── carbon accounting (Read here) 👉 Previous Article: A Data Interpretation Problem Disguised as Mathematics
│ └── carbon intensity 👉 (You are here)
├── 2. Measurement Systems (Up Next: Scope 1, 2, 3 & Emission Factors) 👉 (Upcoming)
- Our Methodology: From Basic Concepts to Financial Impact.
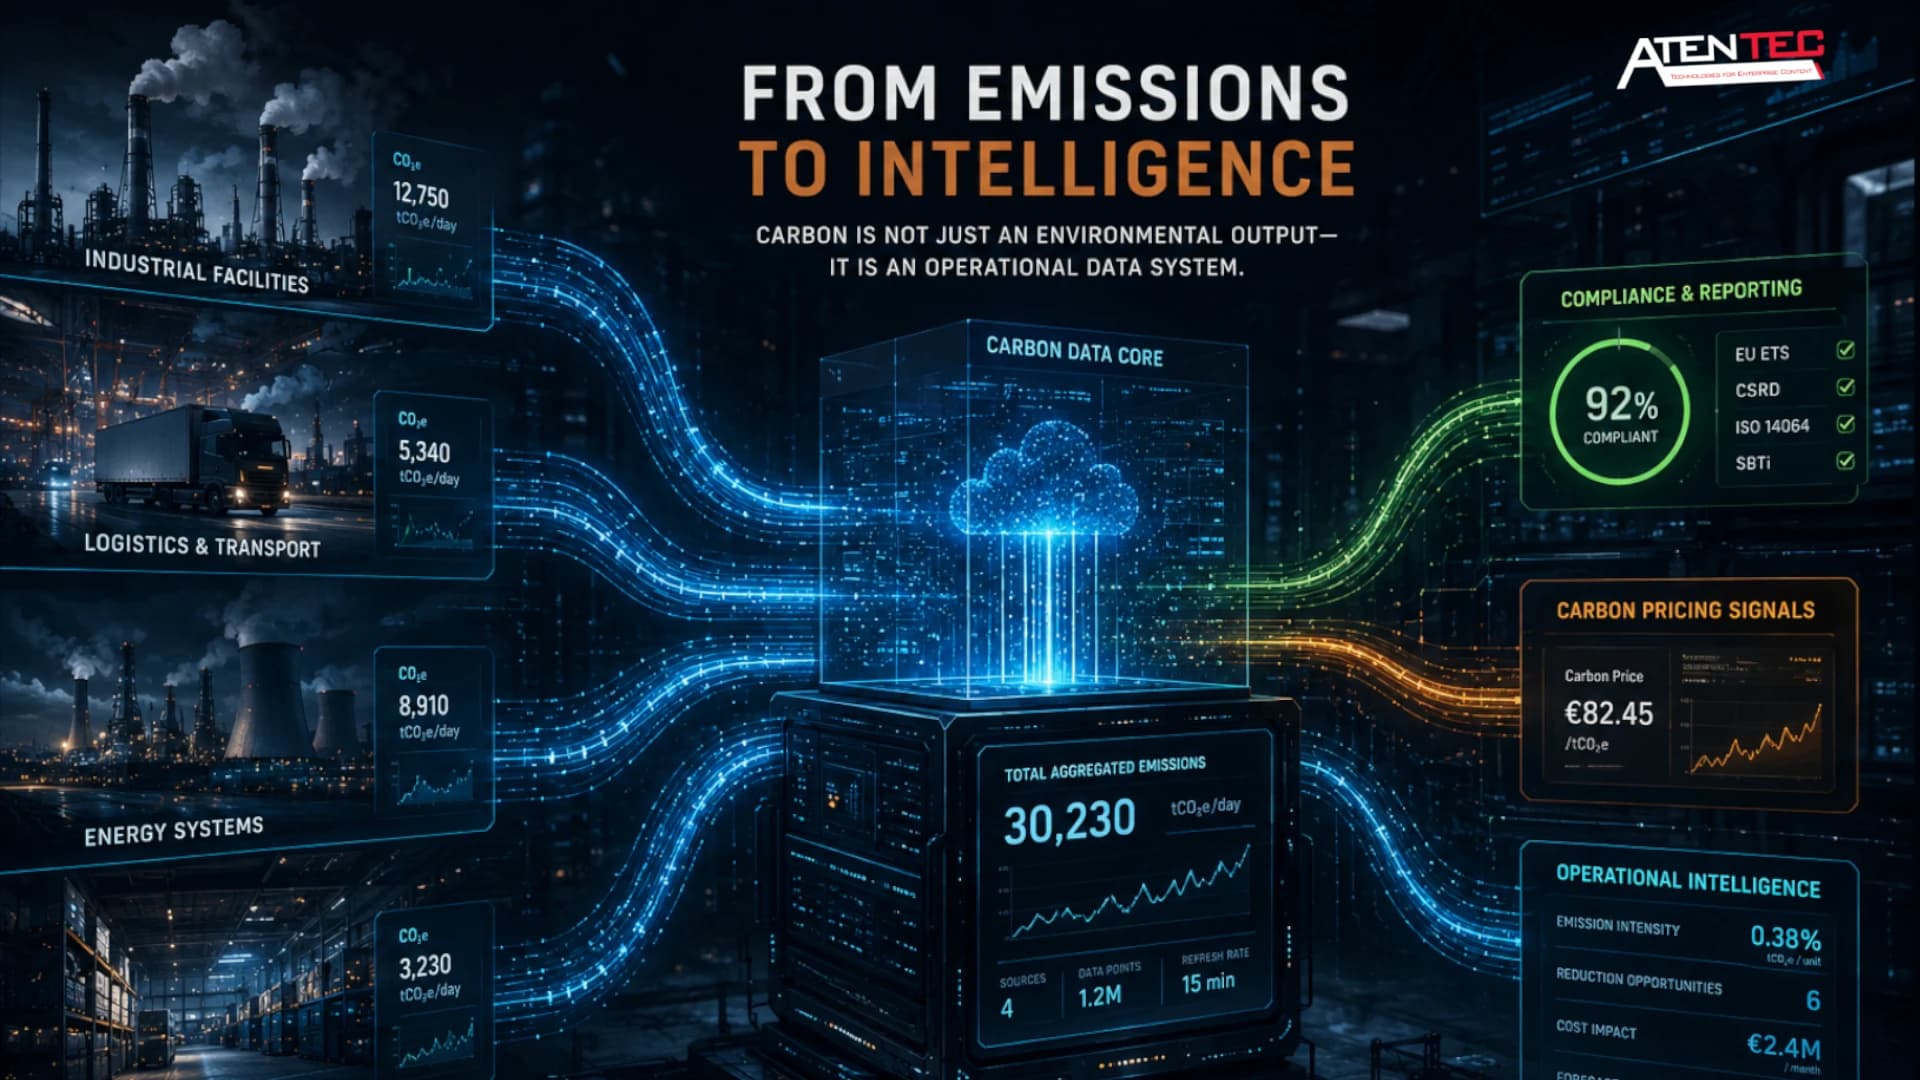
“We turn carbon emissions into an industrial data system that drives compliance, pricing, and operational decisions.”
Because the real question is no longer:
How much do we emit?
But rather:
How do we use emissions data to drive better decisions?
,And that is where the real transformation begins.
Is your current system capturing your fugitive gases, or are you only seeing the CO₂? Discover how I-DNTITI turns molecular data into strategic pricing and compliance certainty.
"We turn carbon emissions into an industrial data system that drives compliance, pricing, and operational decisions."