GHG Emissions: Why CO₂ Is Not the Whole Story — and the Expensive Blind Spots You Are Missing
What are GHG (Greenhouse Gas Emissions) and why CO₂ isn’t the whole story?
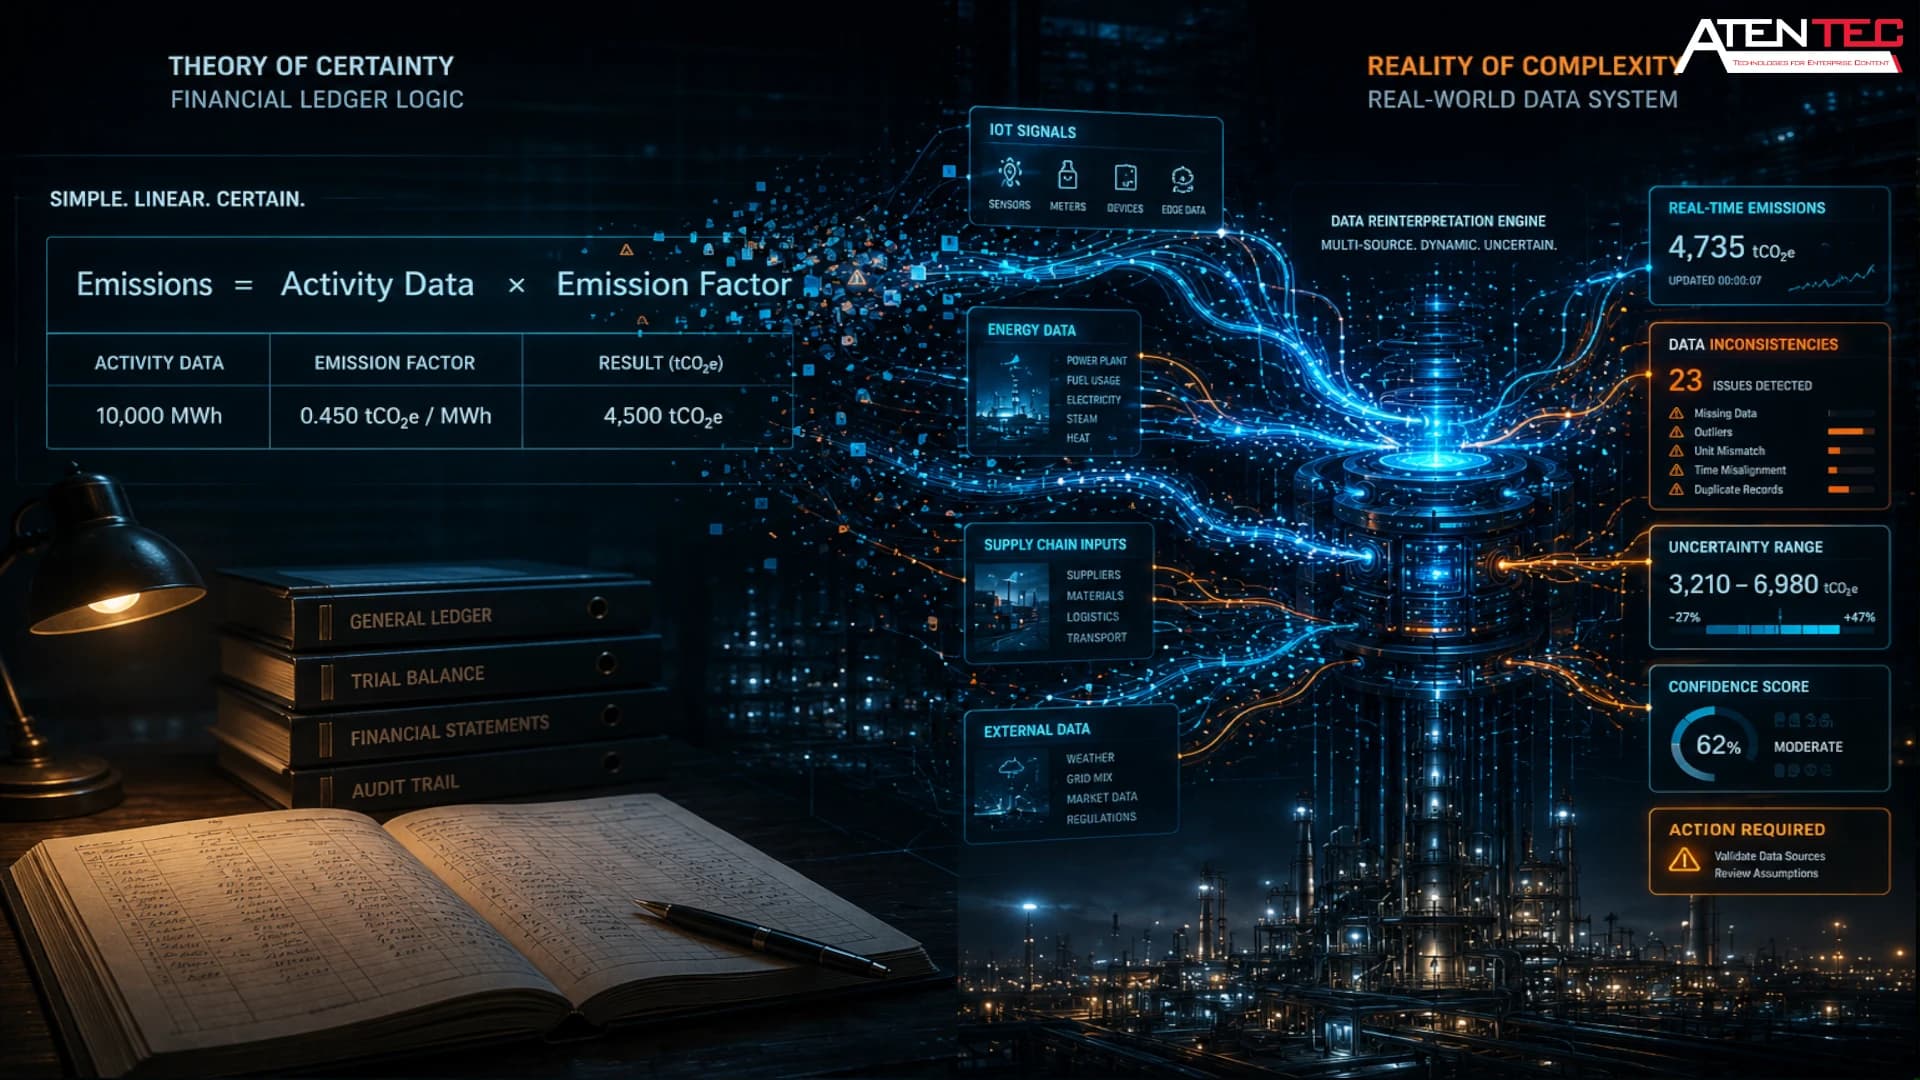
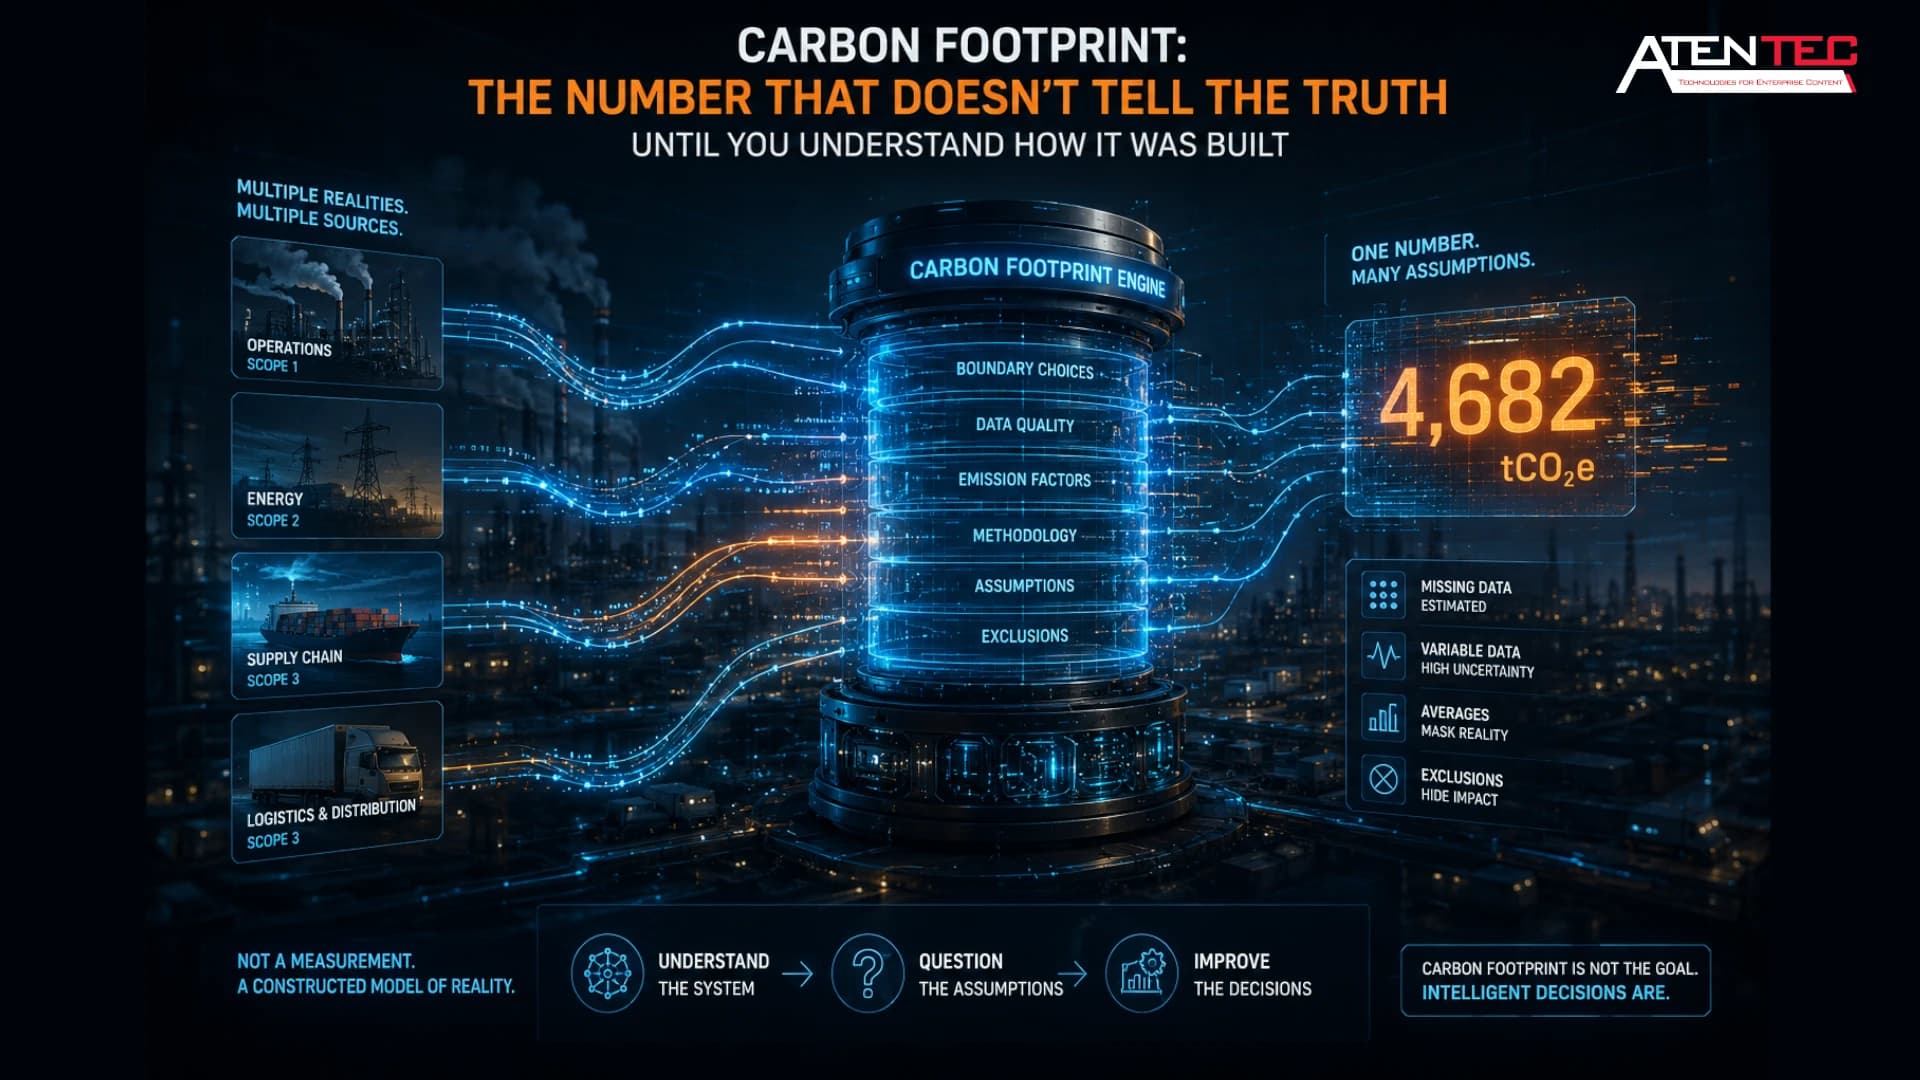
In global carbon discourse, “carbon dioxide” (CO₂) has become the dominant shorthand for describing all greenhouse gas emissions. Corporations report “carbon footprints,” set net-zero targets, and design sustainability strategies that are often centered around a single metric.
This simplification is useful for communication, but it becomes misleading when it is treated as an operational model.
The reality is that CO₂ is only one part of a much broader system of GHG emissions, where different gases behave differently, originate from different processes, and carry different levels of environmental and financial risk.
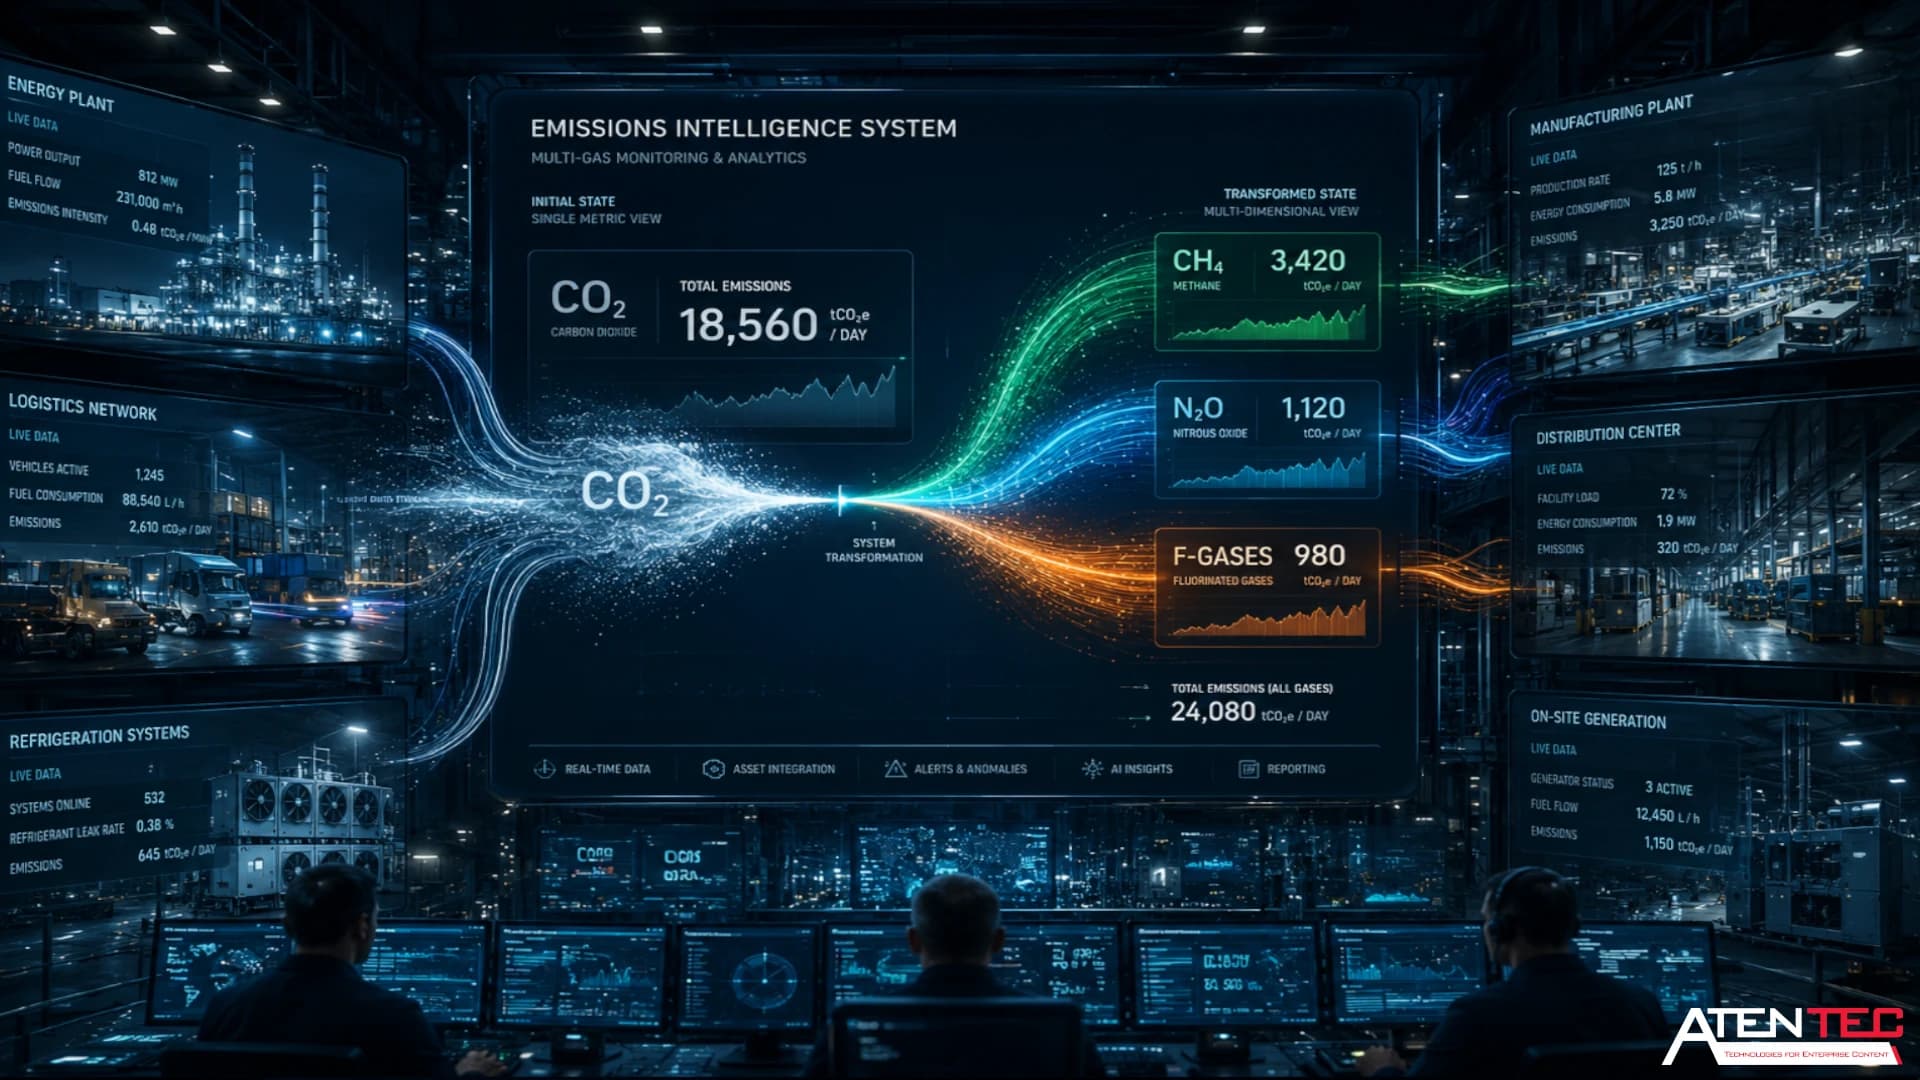
These include methane (CH₄), nitrous oxide (N₂O), and fluorinated gases (F-gases), each with distinct warming profiles and regulatory implications.
For AtenTEC, the principle is straightforward: we treat emissions as an industrial data system, not a reporting endpoint. This means moving beyond simplified aggregation and understanding emissions as a multi-gas operational structure.
The Illusion of Equivalency: The Science Behind the Numbers
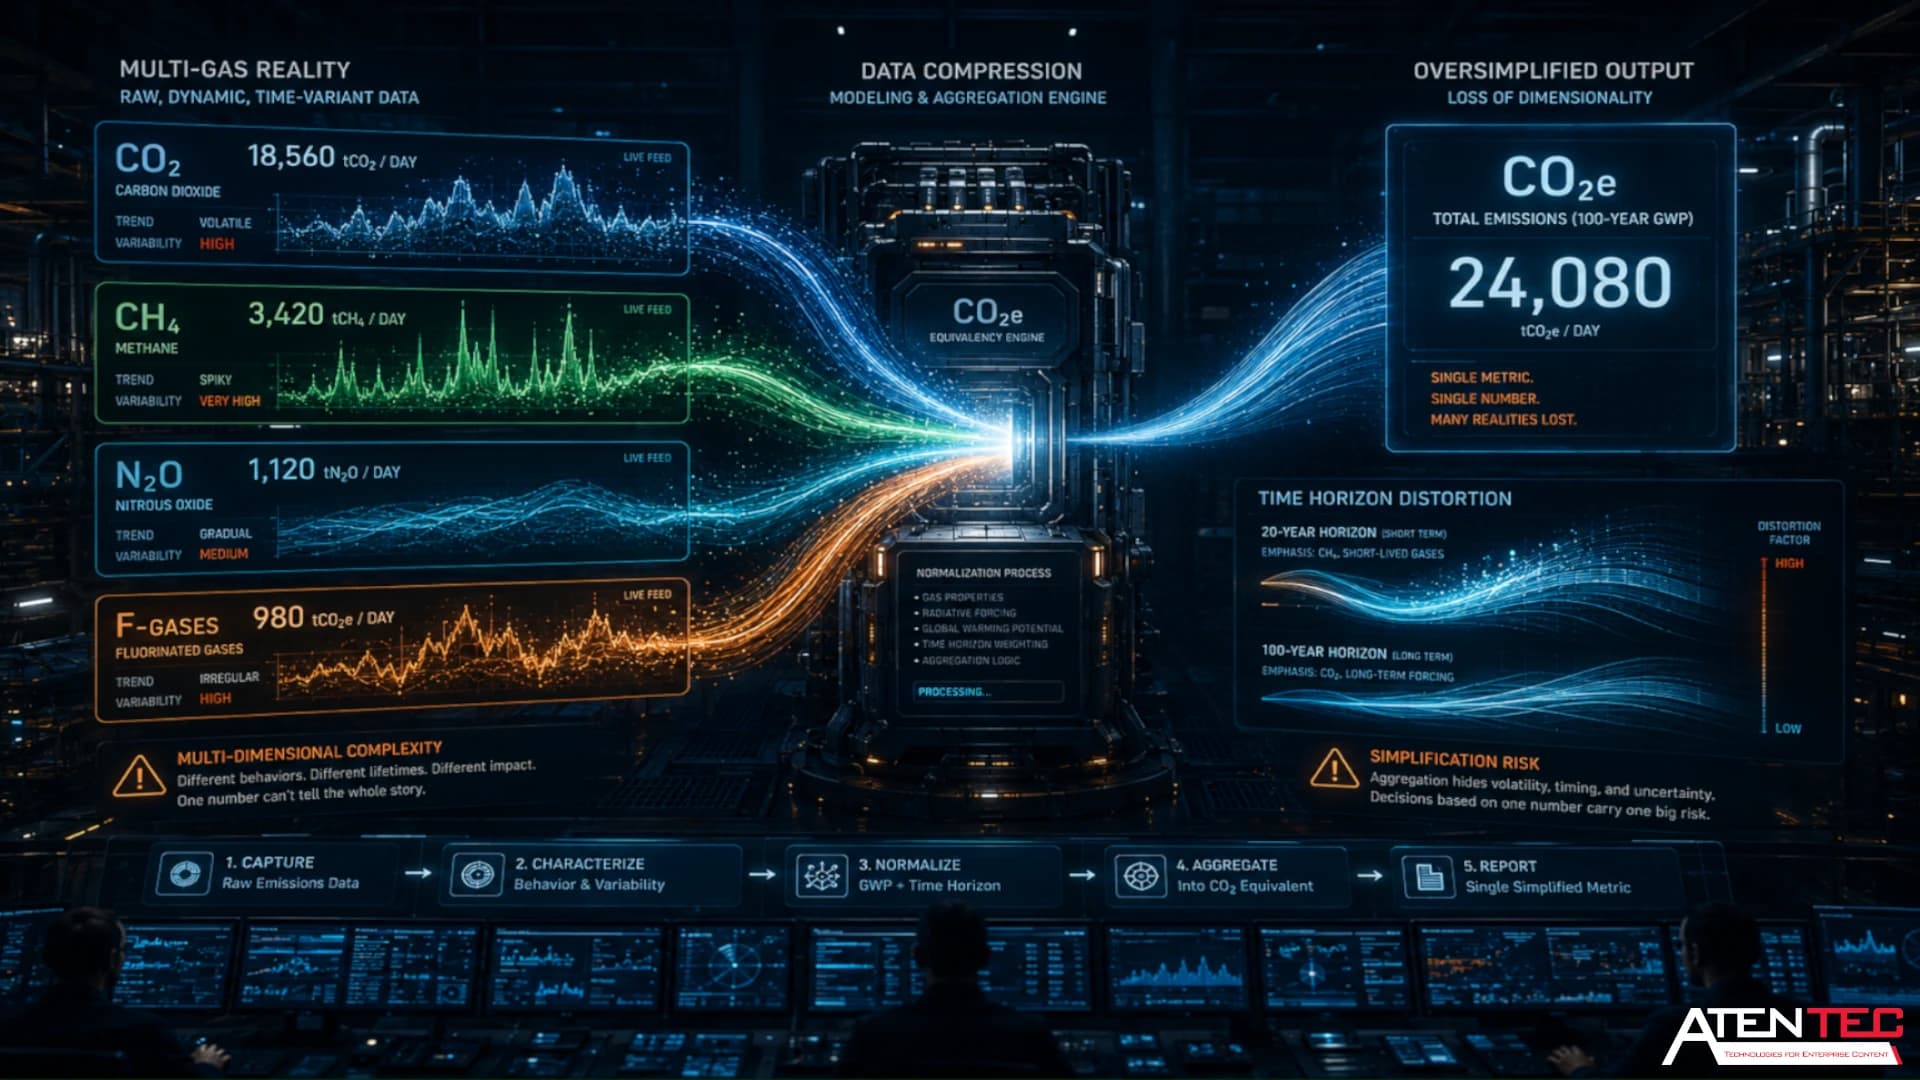
To compare different greenhouse gases, the carbon accounting world uses a metric called Global Warming Potential (GWP). This allows all gases to be converted into a common unit: CO₂ equivalents (CO₂e).
Emissions in CO₂e = Mass of GHG × GWP of that gas
This approach is standardized by the IPCC Assessment Reports (AR5/AR6) and is widely used across regulatory frameworks.
However, GWP introduces an important abstraction: it compresses time-dependent behavior into a single value.
For example, methane (CH₄) has a GWP of about 27–30 over 100 years (AR6), but around ~80 over a 20-year horizon, reflecting its stronger short-term warming impact.
If methane leaks are evaluated only through long-term averaging, the immediate environmental and regulatory exposure can be underestimated.
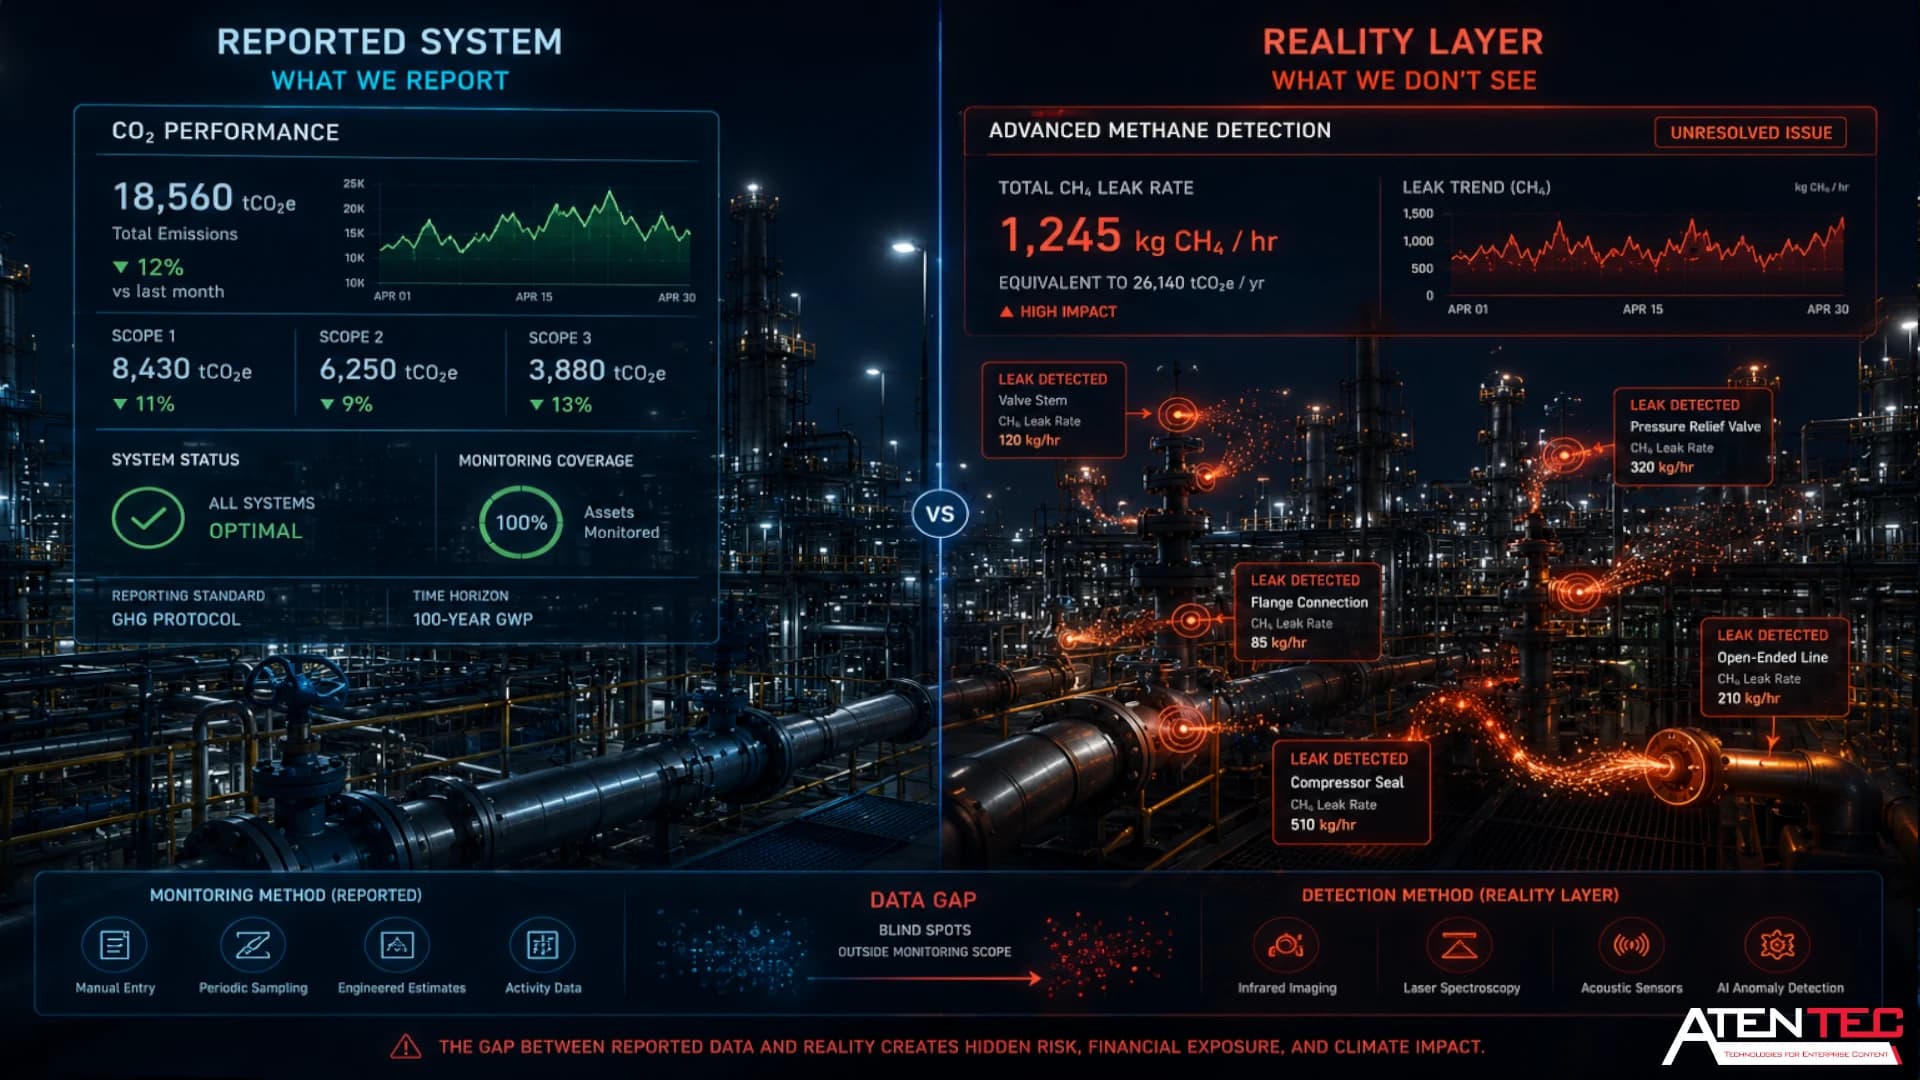
Example 1: The Energy Sector’s Invisible Leak
Consider a natural gas processing facility. Most operational focus is placed on improving combustion efficiency to reduce CO₂ emissions from turbines and engines.
However, small fugitive methane leaks from valves, compressors, and pipelines can create a disproportionate environmental impact compared to combustion improvements.
These emissions are often estimated rather than continuously measured, which creates blind spots in operational reporting.
As methane regulation becomes more granular in regions such as the EU, these previously “invisible” emissions increasingly translate into financial and compliance exposure.
The Specificity of Industrial GHGs: Beyond Carbon Dioxide
To build a resilient emissions system, organizations must map gases to their actual industrial origins.
Each greenhouse gas behaves differently and is associated with different operational systems.
| Greenhouse Gas | Key Industrial Sources | 100-Year GWP (AR6) | Operational Risk Profile |
|---|---|---|---|
| CO₂ | Fossil fuel combustion, cement, industrial processes | 1 | Widely measured, heavily regulated |
| CH₄ | Gas leaks, waste, agriculture | ~27–30 | High short-term climate impact, leakage-sensitive |
| N₂O | Fertilizer use, chemical production | ~273 | High potency, process-specific emissions |
| F-gases | Refrigeration, semiconductors, electrical systems | Up to ~23,000+ | Extremely high impact, strict phase-down regulation |
Example 2: The Cold Chain Logistics Dilemma
In cold-chain logistics, operational focus is often placed on reducing diesel consumption through route optimization and fleet efficiency improvements.
However, refrigerant leaks (often HFCs) can have significantly higher climate impact per unit than fuel efficiency gains.
These emissions are typically discovered during maintenance cycles or audits rather than in real time, which creates a gap between operational optimization and actual emissions performance.
The Compliance and Financial Trap of CO₂-Only Thinking
As carbon pricing systems mature, regulatory frameworks such as CBAM (Carbon Border Adjustment Mechanism) and ETS (Emissions Trading Systems) are increasing the granularity of emissions reporting requirements.
While CO₂e remains the dominant global reporting standard, there is a growing expectation in some sectors for more gas-specific visibility, especially for methane and fluorinated gases.
Ignoring non-CO₂ gases can create financial and compliance risks in three main areas:
- Methane-specific regulatory mechanisms are emerging in certain jurisdictions.
- F-gas phase-down policies are increasing the cost of refrigerant management.
- Verification systems are moving toward more data-driven audit processes rather than spreadsheet-based estimation.
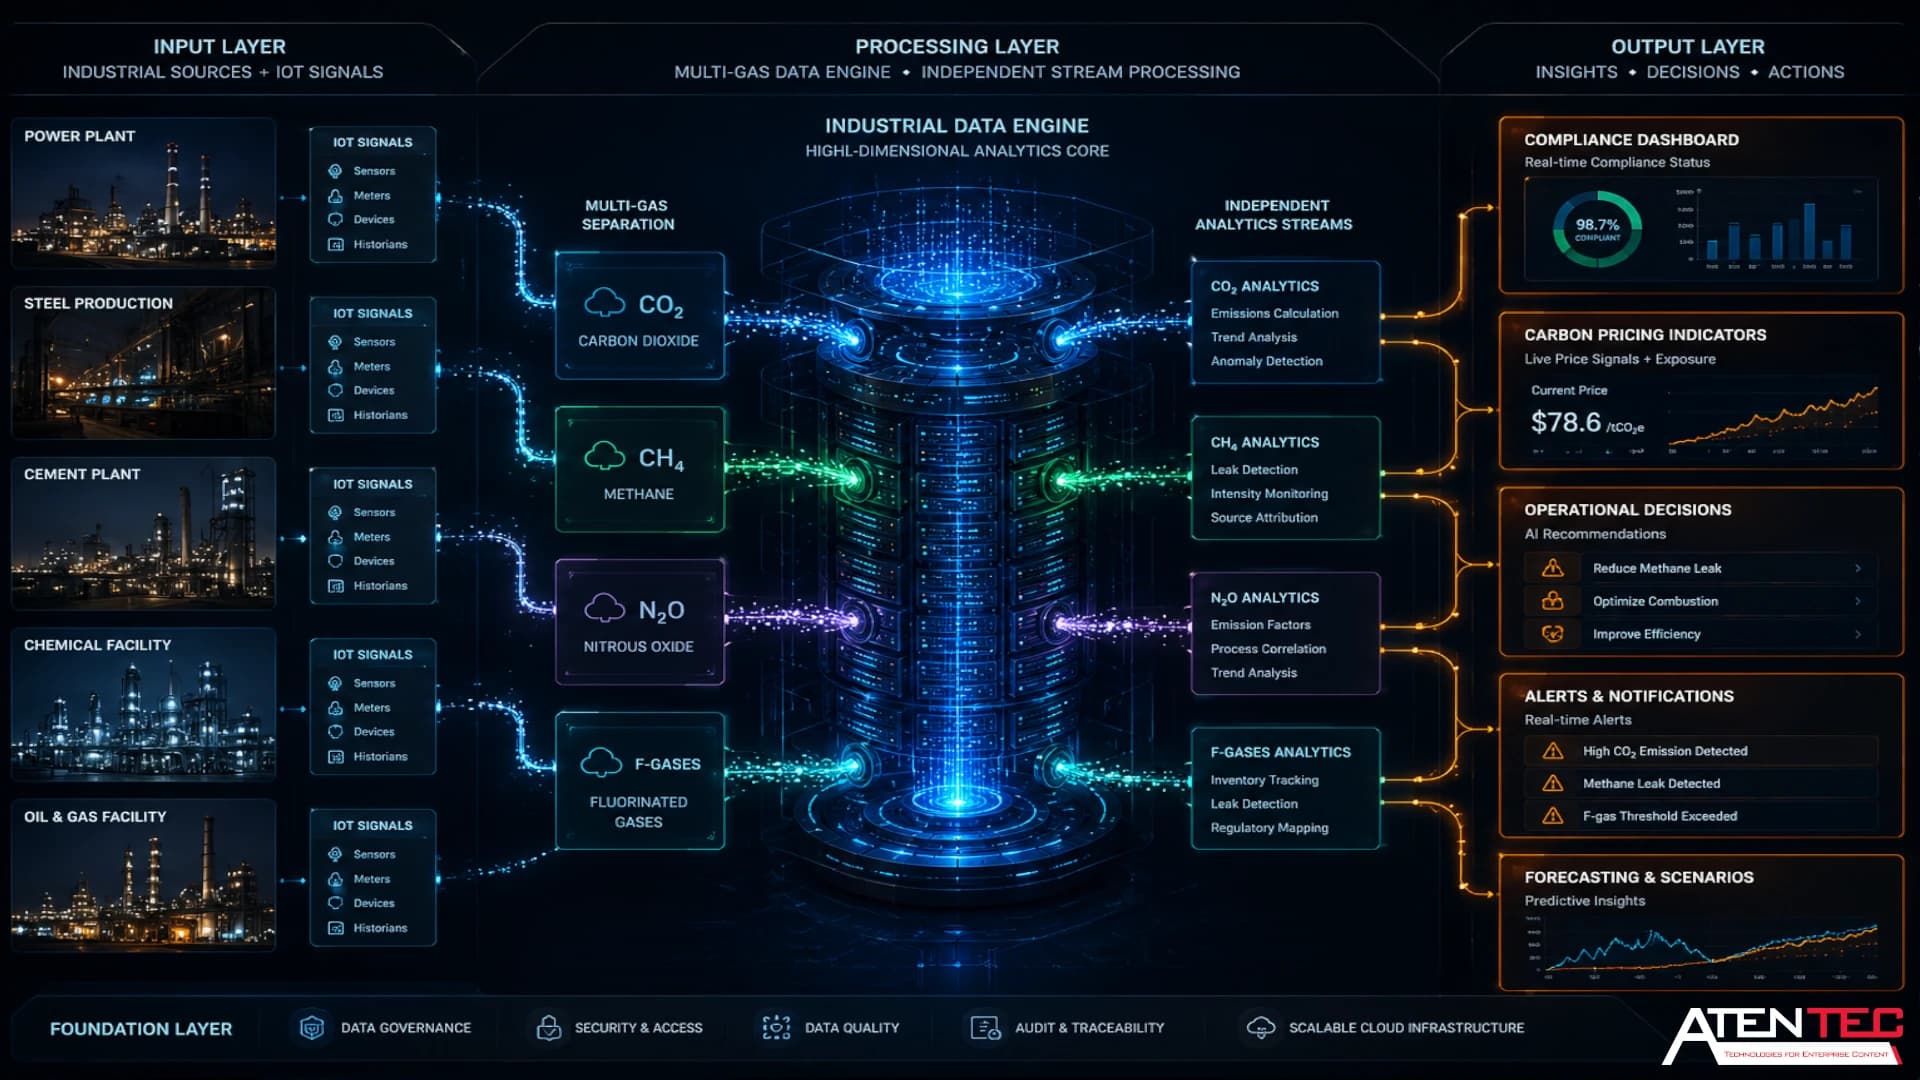
How the AtenTEC Emission Engine Addresses the Multi-Gas Problem
To manage emissions complexity, organizations need to move beyond flat aggregation models.
The AtenTEC Emission Engine is designed around a multi-stream emissions architecture, where gases are not immediately merged into a single CO₂e value, but treated as distinct operational signals.
This enables three core capabilities:
First, emissions are tracked as independent streams (CO₂, CH₄, N₂O, F-gases), preserving gas-level identity instead of immediate aggregation.
Second, the system enables scenario-based analysis across different operational decisions, helping evaluate trade-offs between fuel choices, process efficiency, and emissions composition.
Third, real-time integration with industrial systems (IoT, SCADA, maintenance data) allows earlier detection of anomalies such as leaks or unexpected emission patterns.
Closing Perspective
If sustainability is built only around CO₂, it describes a simplified version of industrial reality rather than the system itself.
GHG emissions are not a single output—they are the result of multiple interacting industrial processes with different physical and temporal behaviors.
Treating them as one aggregated number may be useful for reporting, but it is insufficient for operational decision-making.
A more accurate view of carbon footprint emerges when emissions are treated as a structured system rather than a final metric. In this framing, carbon intensity becomes something that can be traced back to specific processes, decisions, and system behaviors.
What Comes Next
Understanding emissions as a multi-gas system is only the first step.
The next challenge is understanding how this physical reality is translated into structured organizational records that finance teams, auditors, and regulators can actually use.
In the next article, we move from emissions structure to carbon accounting as a system of record, exploring why traditional accounting logic breaks down when applied to thermodynamic and industrial data.
Explore More in This Series
This article is part of a structured series that moves from foundational concepts to operational systems:
We started with carbon footprint, where emissions are introduced as a simplified global metric. We expanded into GHG emissions, where the complexity of multiple gases becomes visible. Next, we will explore carbon accounting, where emissions become structured organizational data. After that, we will move into carbon intensity, where performance is measured at a process level rather than a corporate average.
Together, these form a progression from visibility → structure → decision intelligence.
At the center of this transition is a broader shift: moving from reporting emissions to understanding them as a system.
That is where the next layer begins.
And that is also where I-DNTITI comes in — not as a reporting tool, but as a bridge between industrial emissions data and structured decision systems.
If this article explains what emissions are, the next one explains what they become when they enter an operational intelligence layer.
Explore More:
├── 1. Core Concepts 👉 Content Series Overview
│ ├── carbon footprint (Read here) 👉 First Article: Carbon Footprint: The Number That Doesn’t Tell the Truth
│ ├── GHG emissions 👉 (You are here)
│ ├── carbon accounting 👉 (Up next)
│ └── carbon intensity 👉 (Upcoming)
- Our Core Framework: Understand how we map this system 👉 From Basic Concepts to Financial Impact.
Because the real question is no longer:
How much do we emit?
But rather:
How do we use emissions data to drive better decisions?
,And that is where the real transformation begins.
"We turn carbon emissions into an industrial data system that drives compliance, pricing, and operational decisions."